The Next-Generation platform for decentralized pathogen monitoring and epidemiological surveillance. PhyloTrace is an open-source desktop application with graphical interface and team collaboration features.
For research use only. PhyloTrace is not a medical device and is not intended for use in diagnostic procedures, for guiding treatment decisions, or for the management of individual patients.
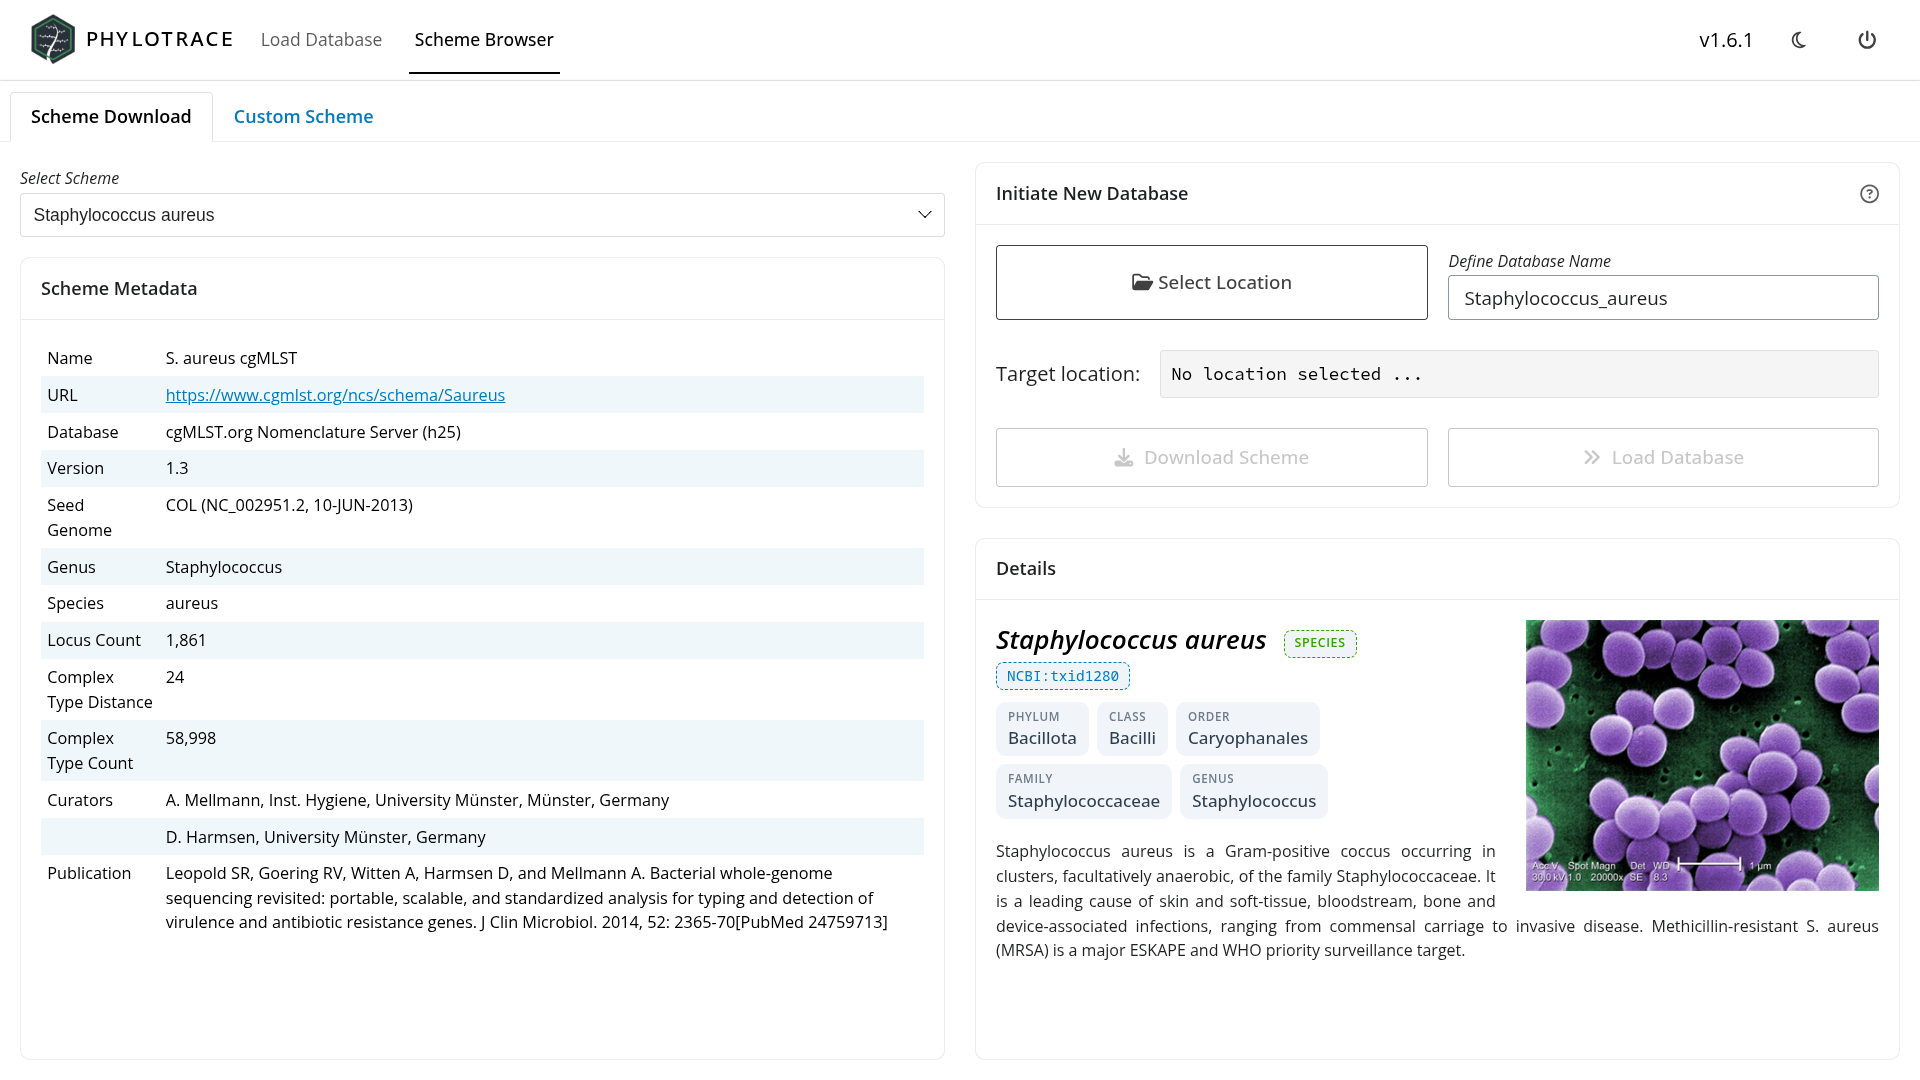
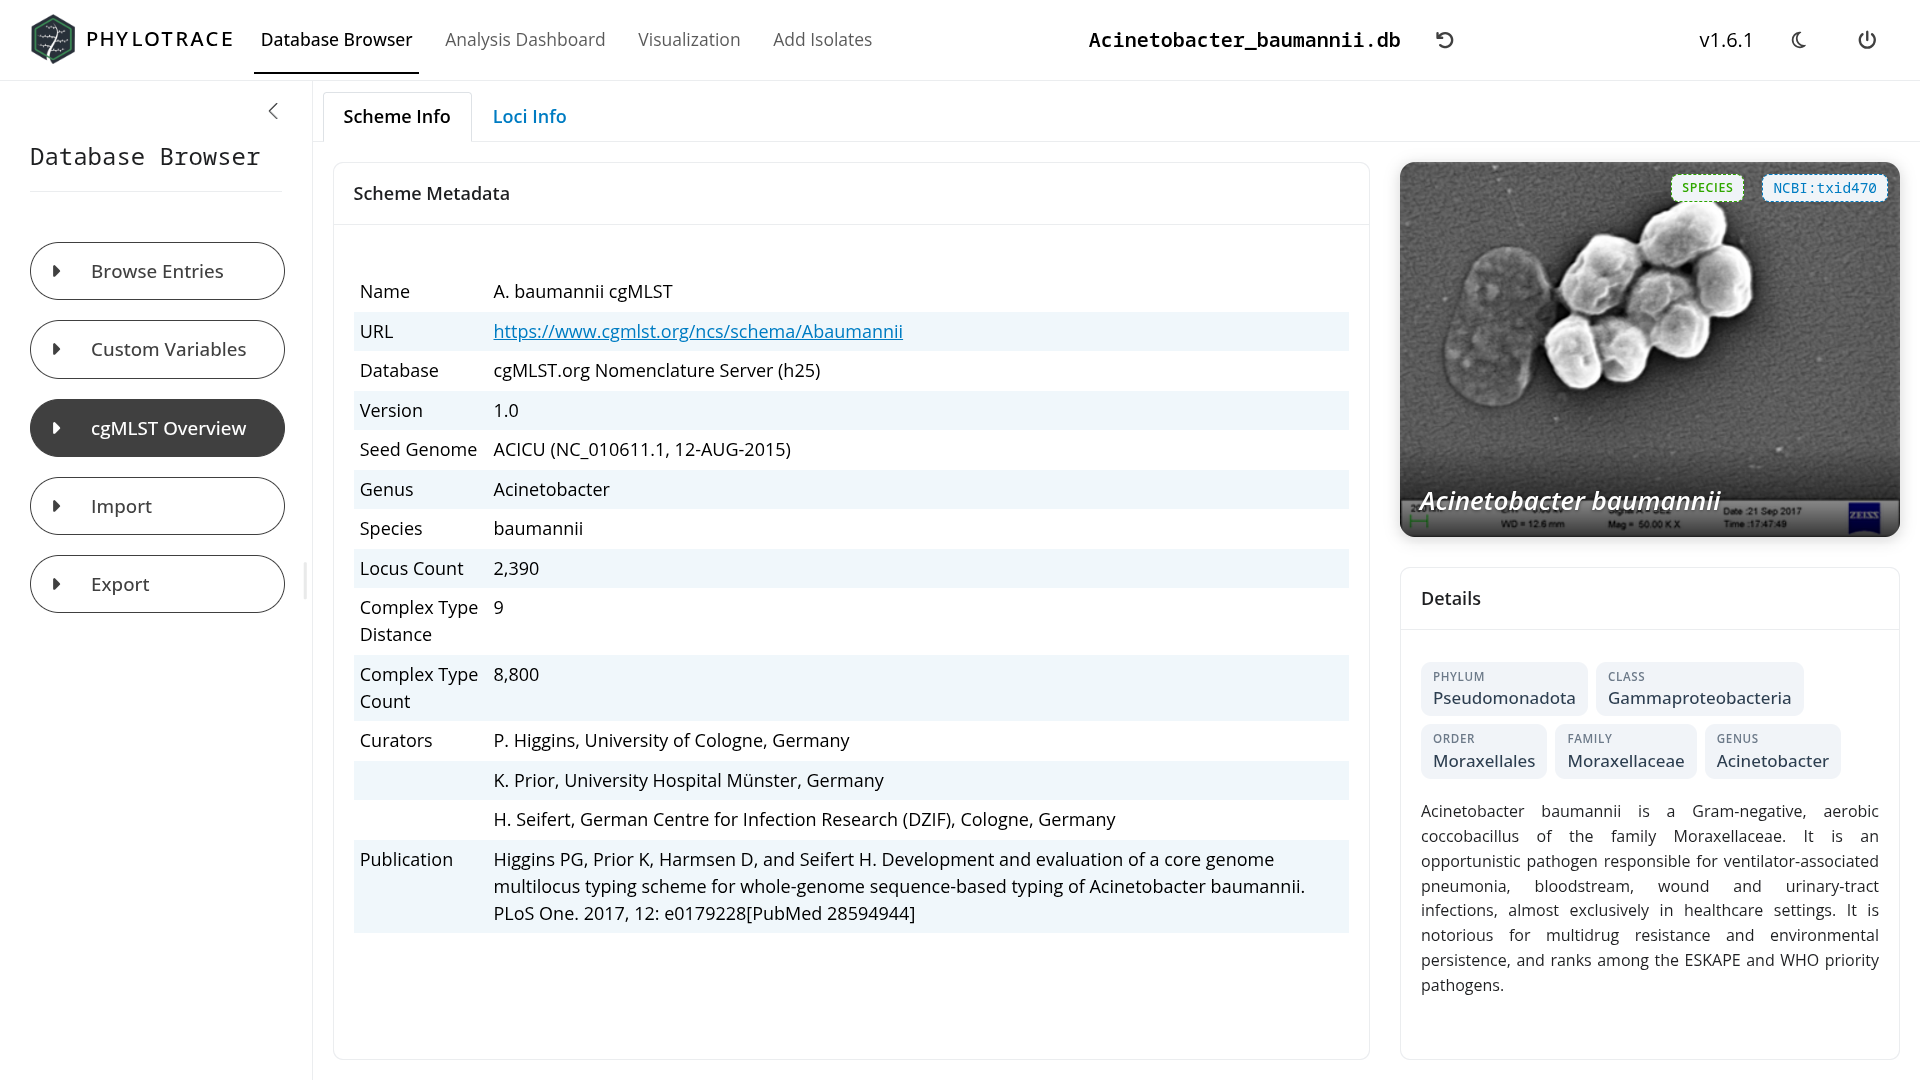
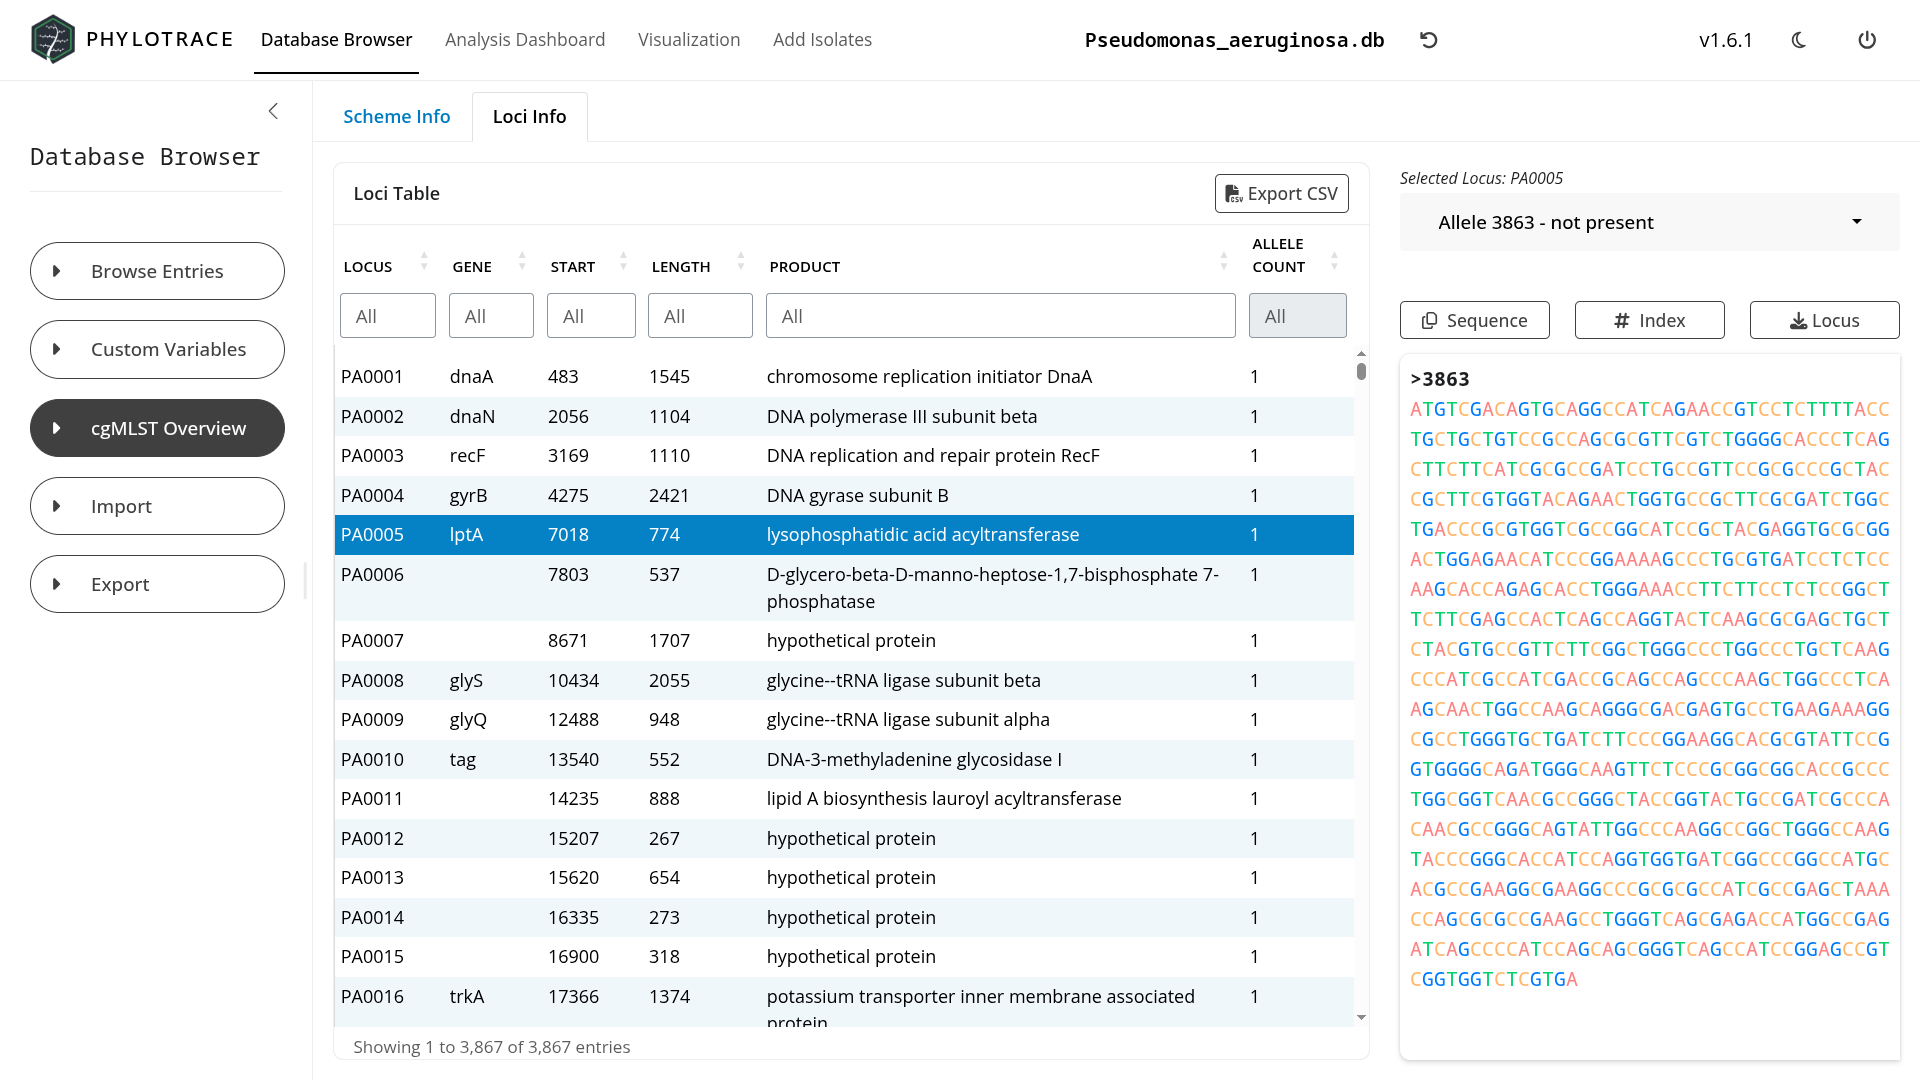
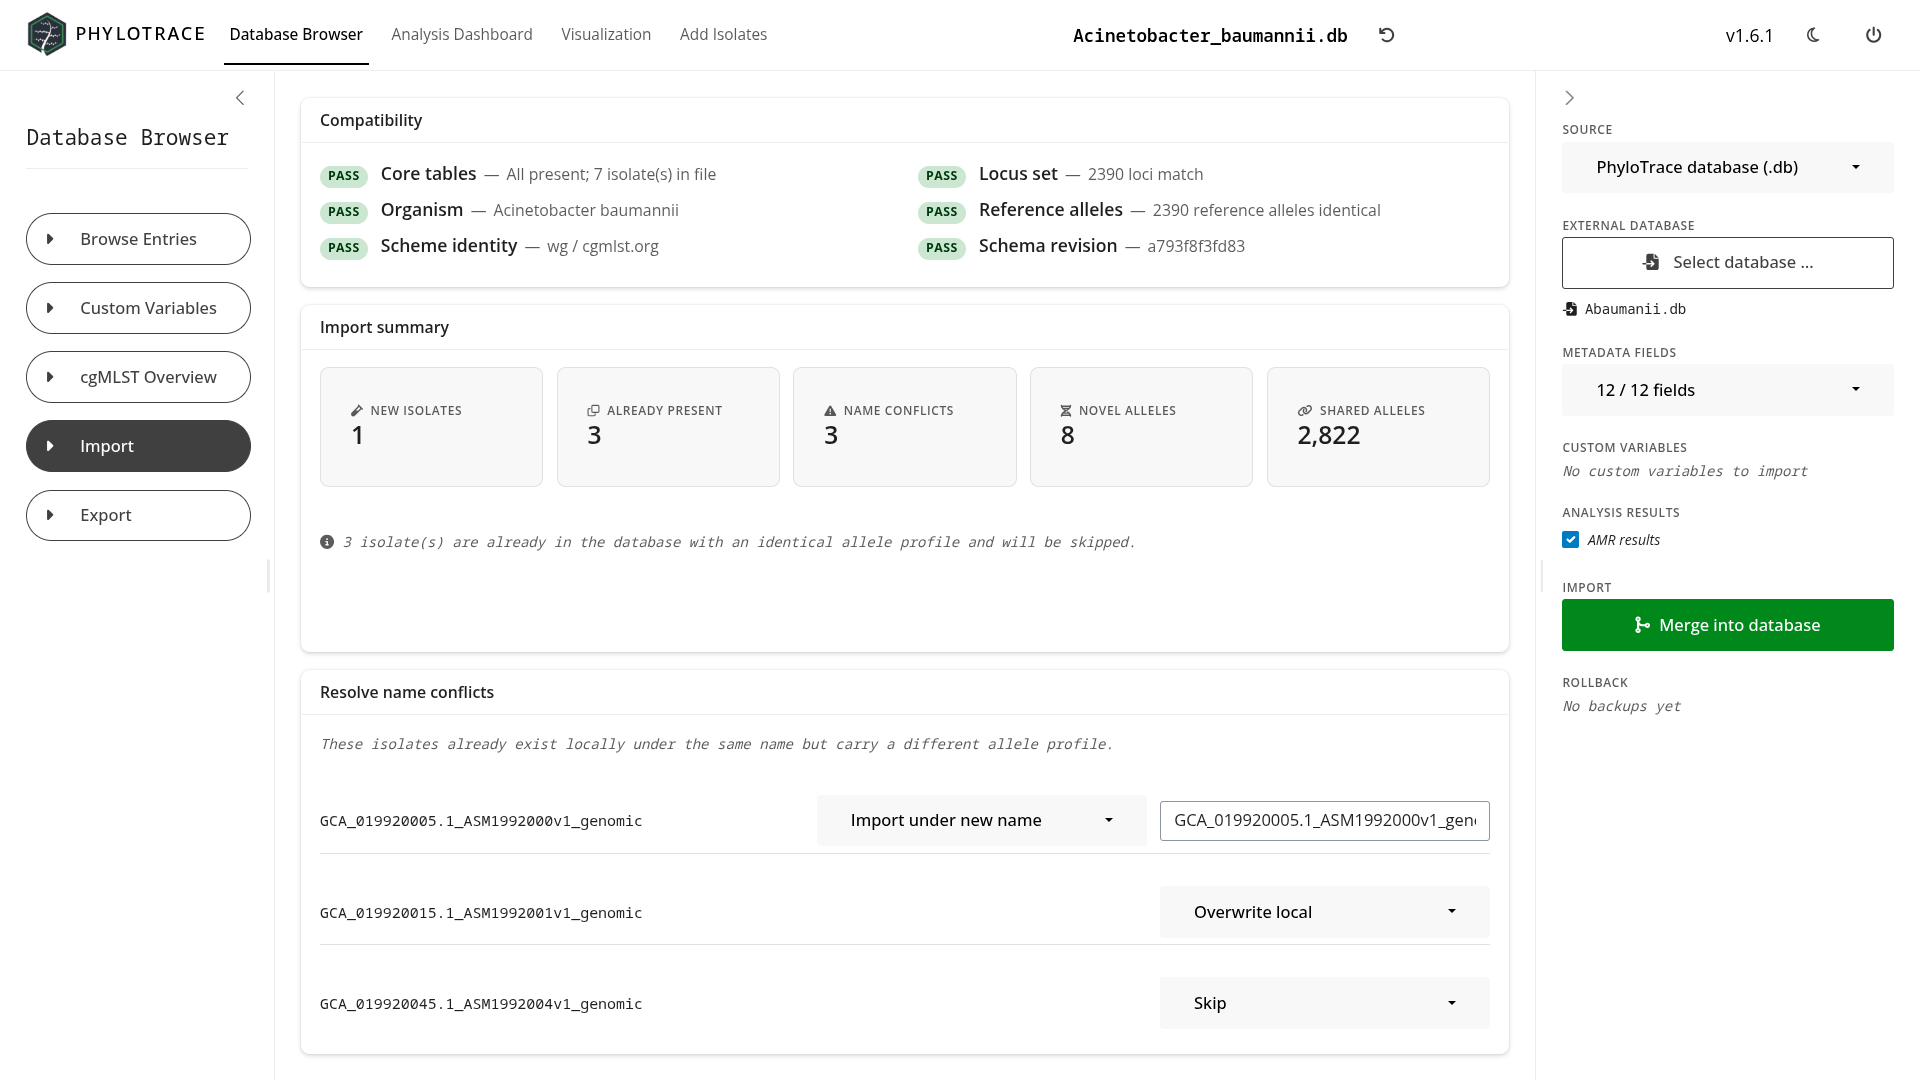
High-resolution strain typing using standardized cgMLST and classical MLST schemes. Currently 42 bacterial schemes can be interfaced with cgMLST.org and are continuously updated. Support for custom schemes or other databases like PubMLST will soon be added.
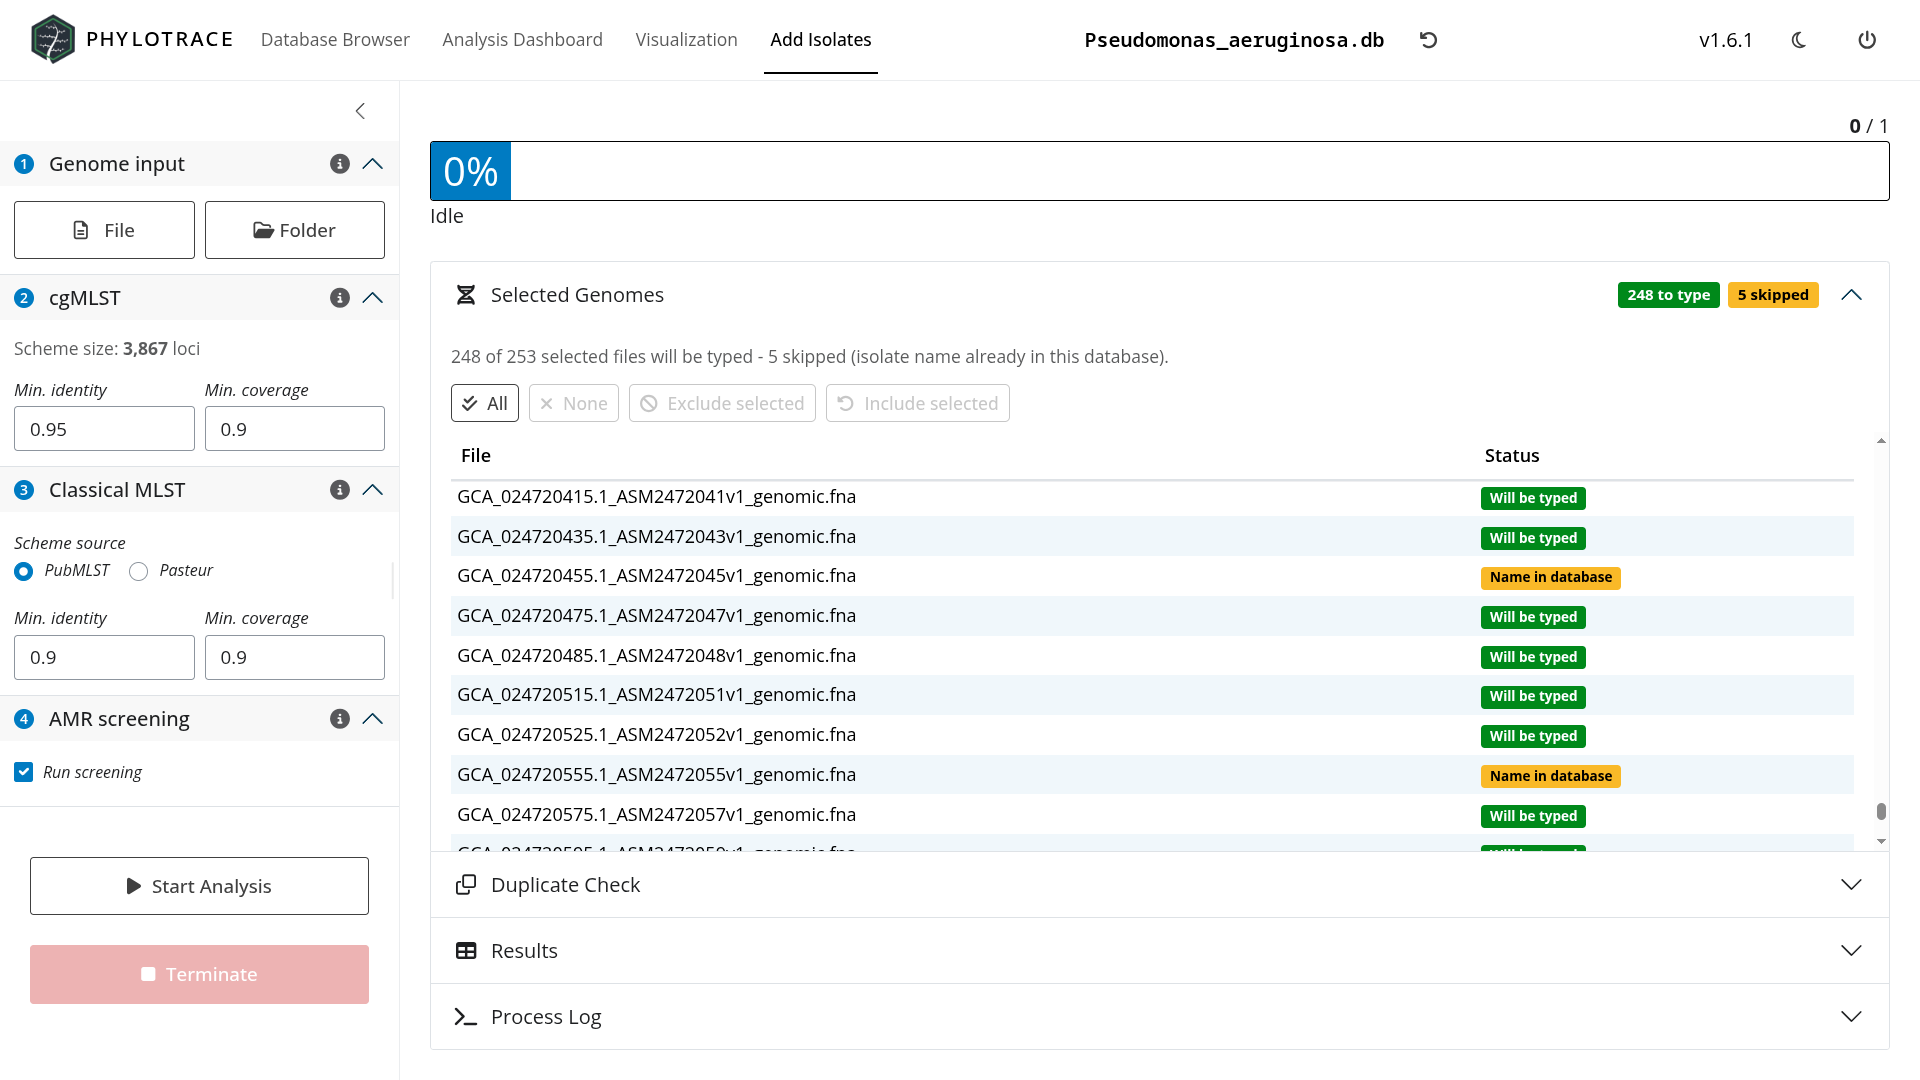
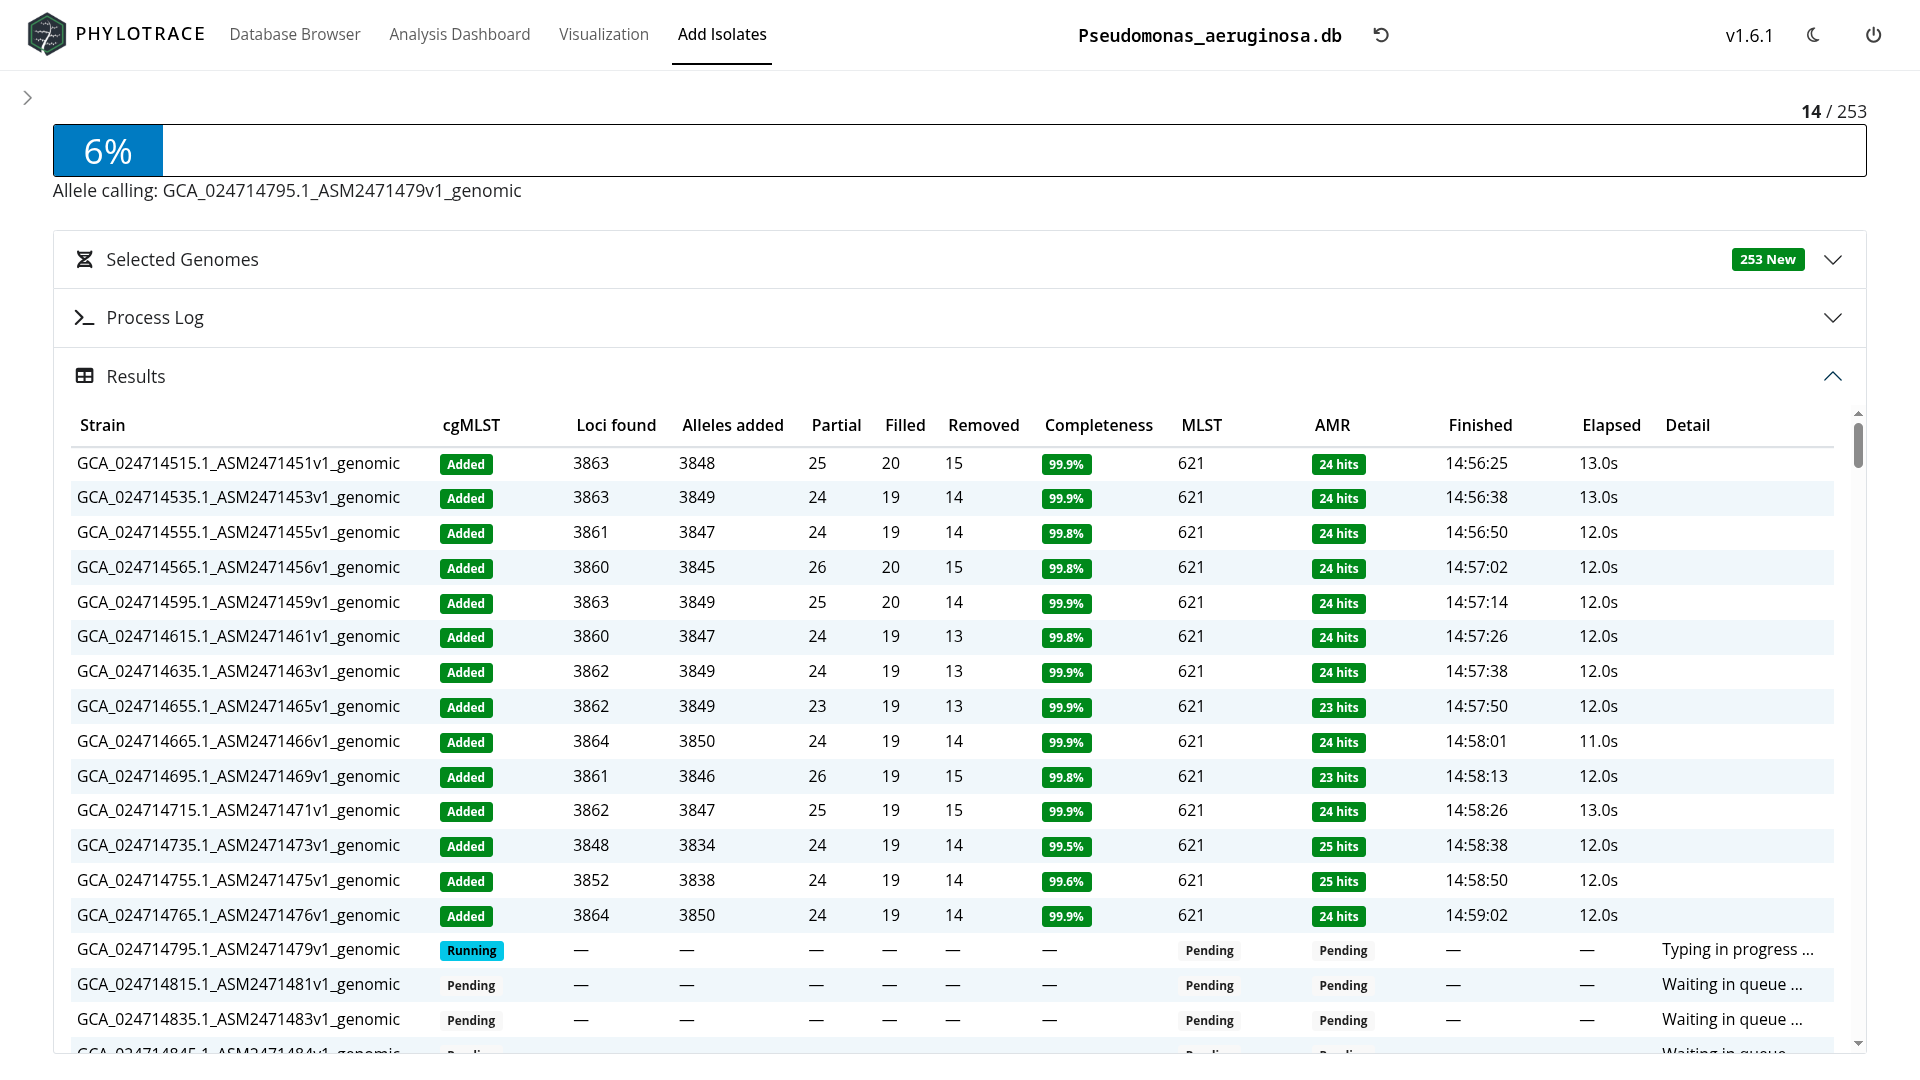
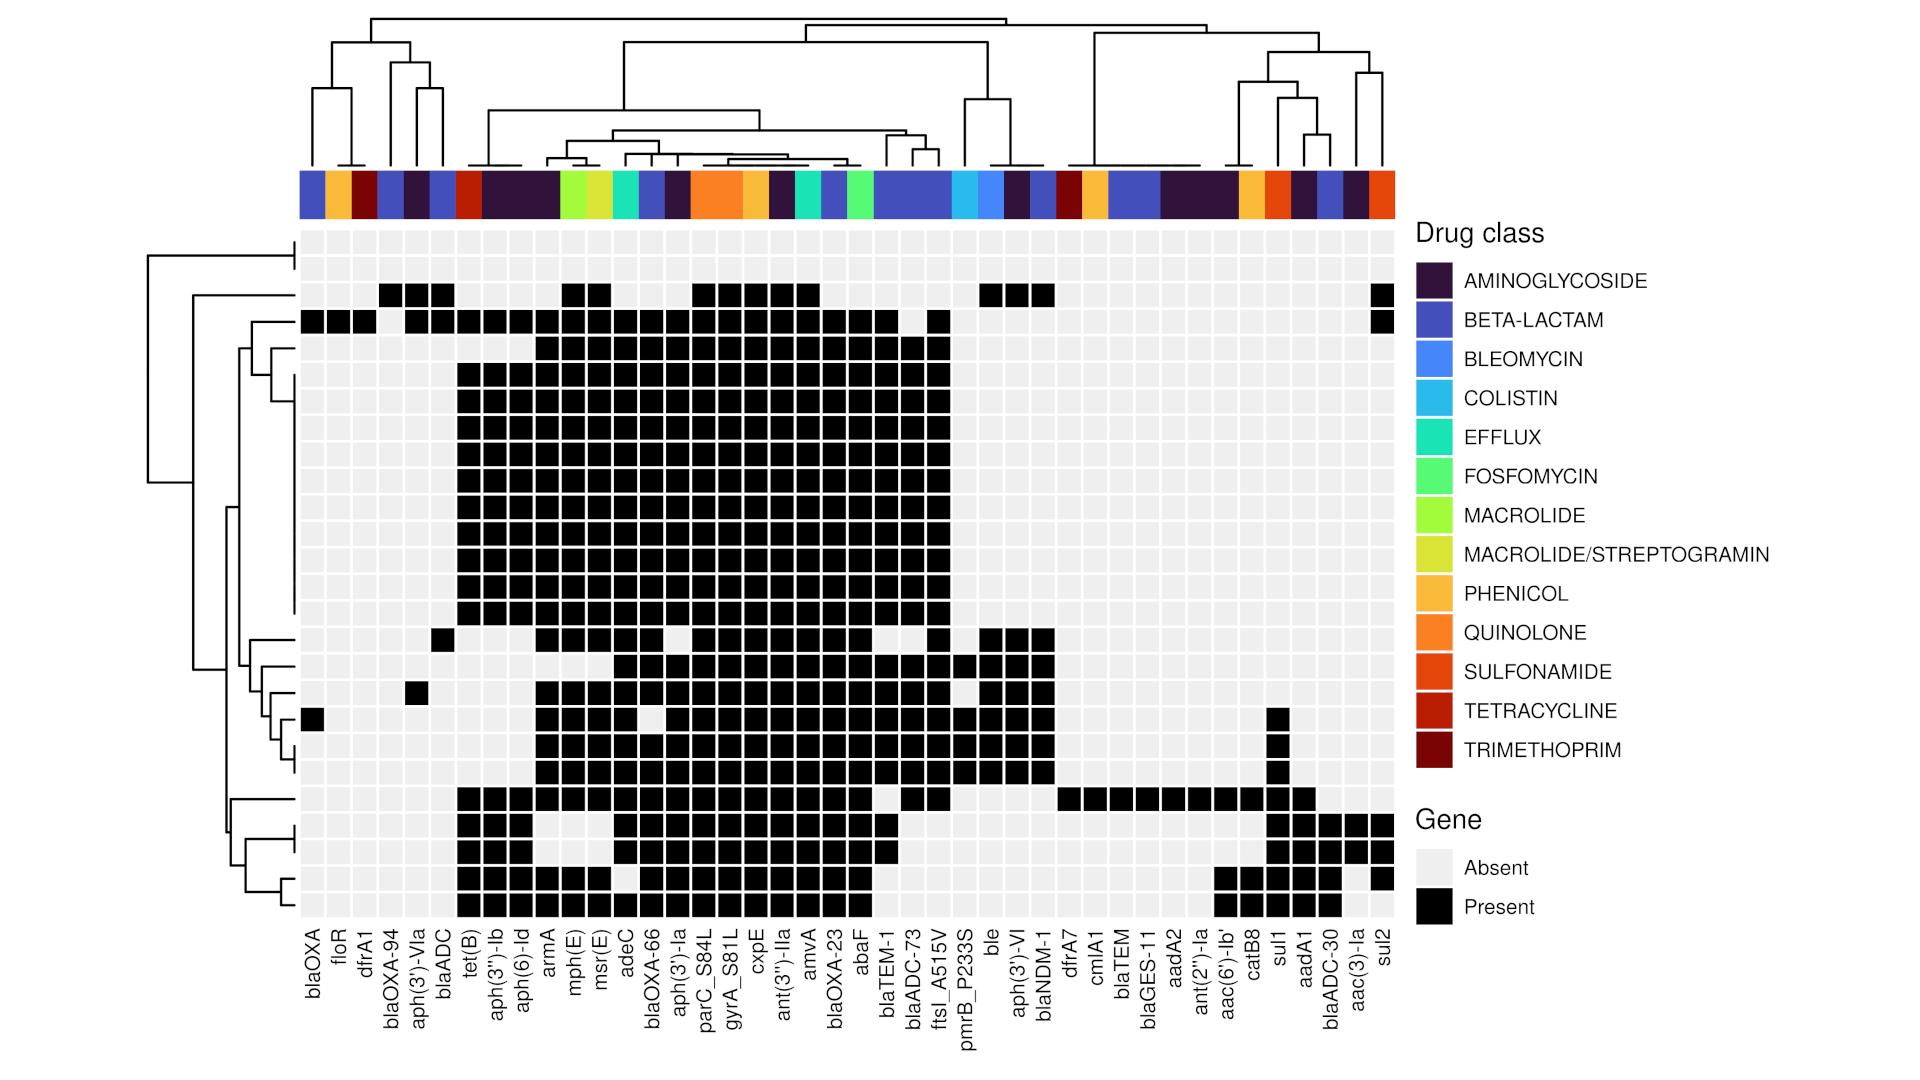
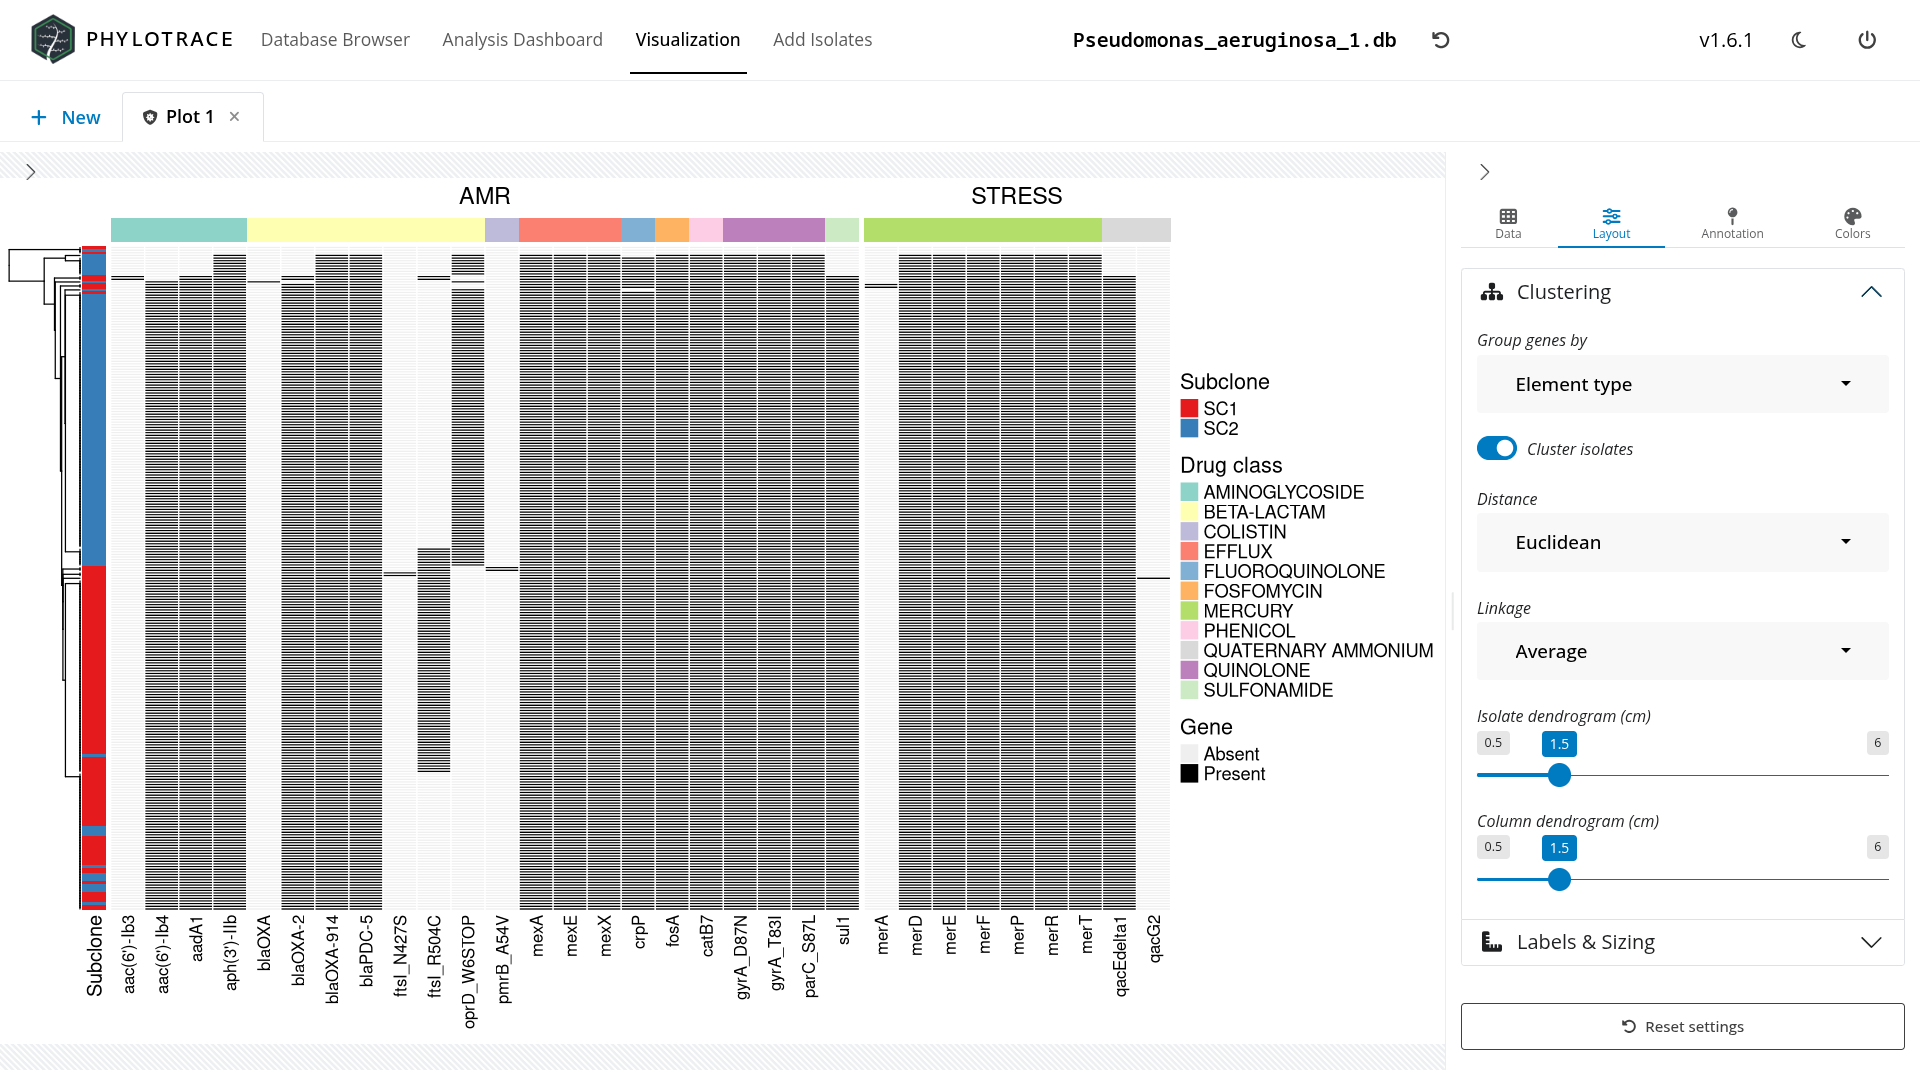
Screen genomic assemblies against curated resistance gene databases, virulence factor registries, and point mutation panels to detect antimicrobial resistance mechanisms immediately.
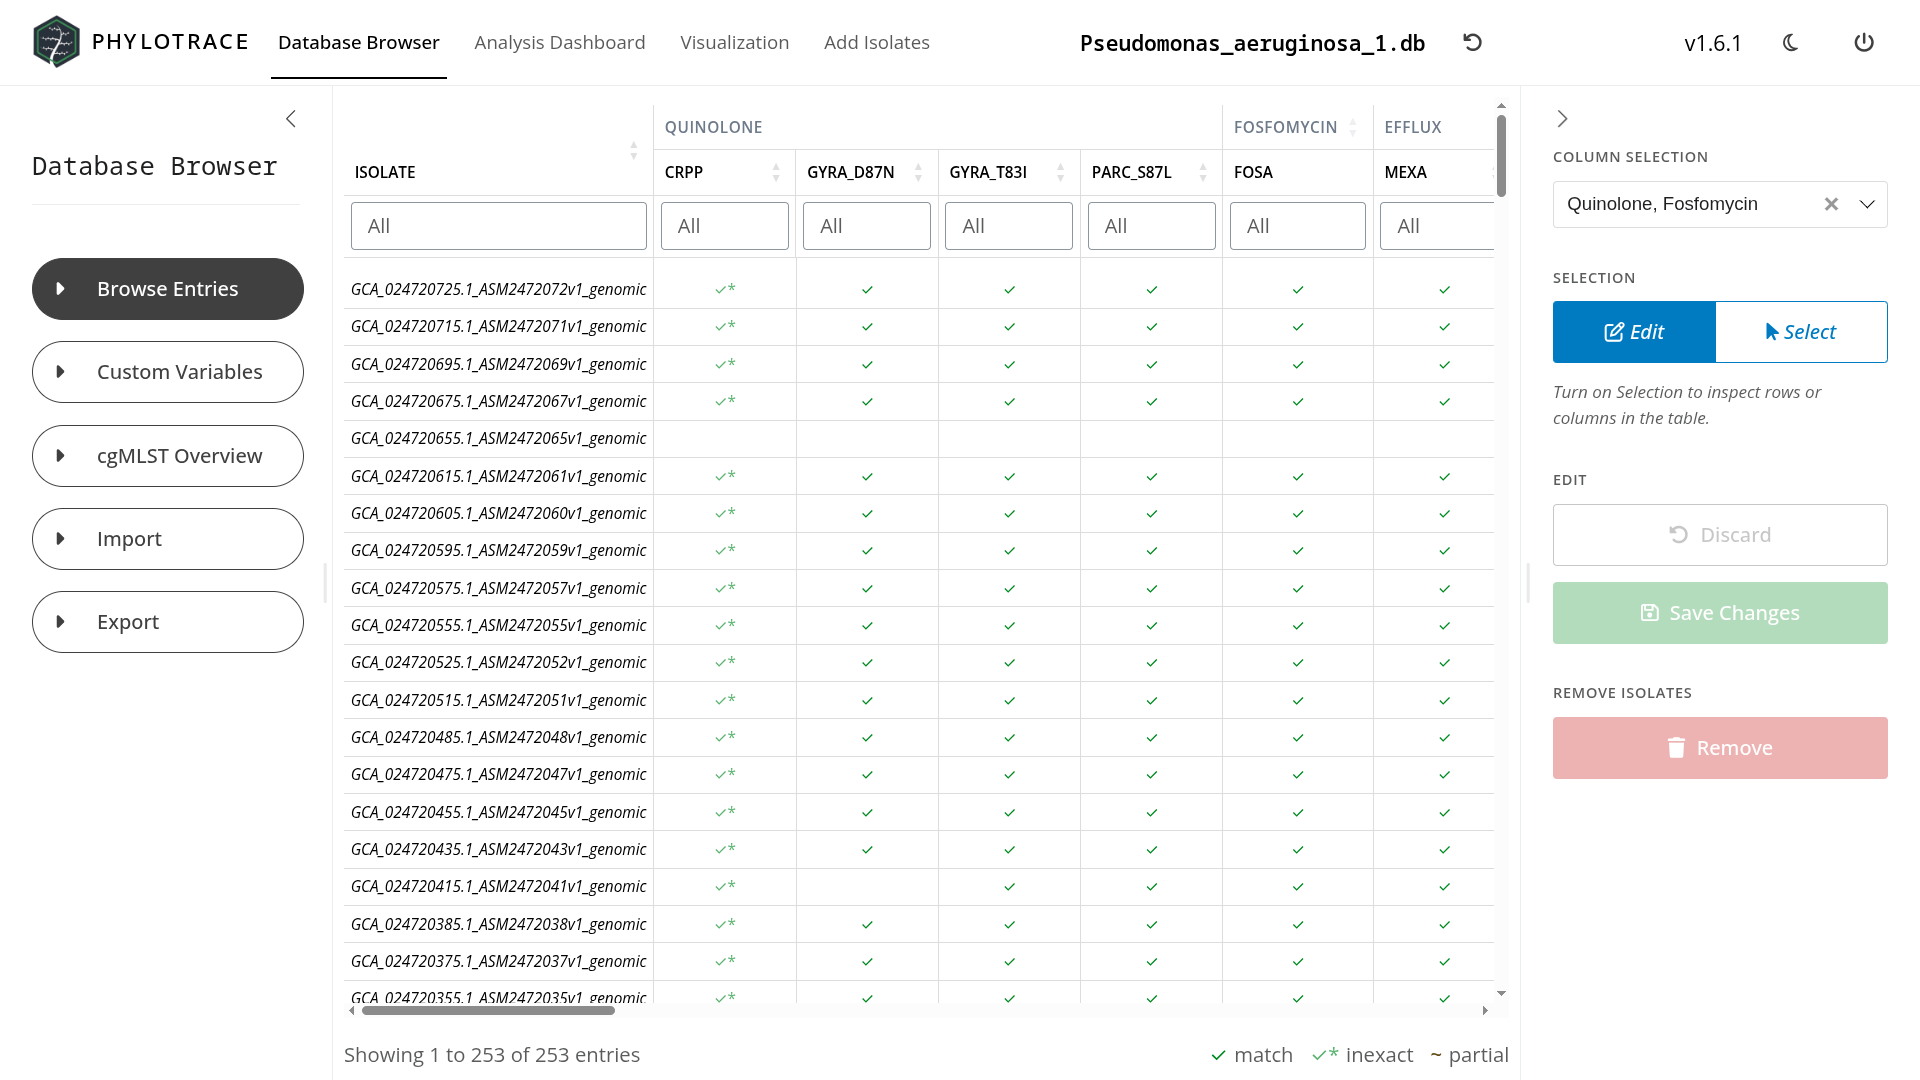
Centralized local or server-based storage allowing scalable in-app data management. Simple interface for isolate storage, indexing, seamless background synchronizations and more without reliance on external utilities.
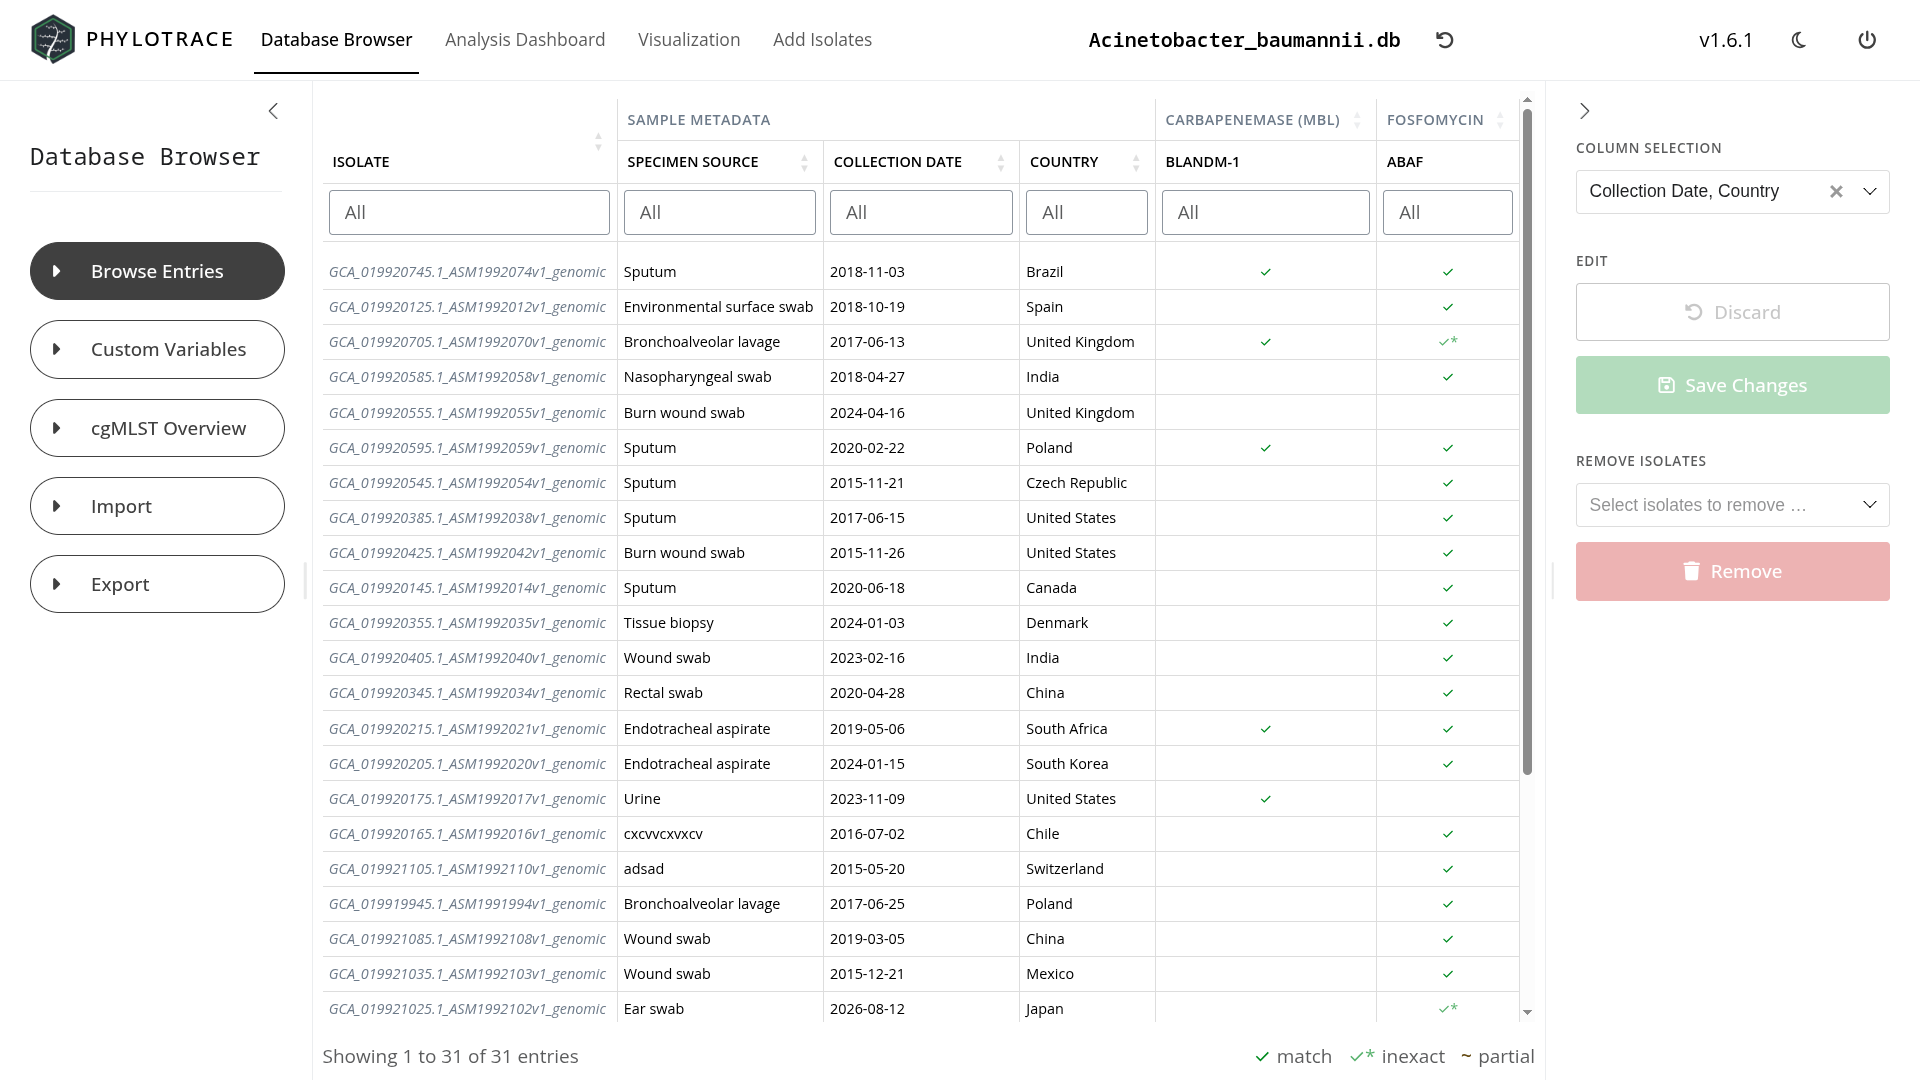
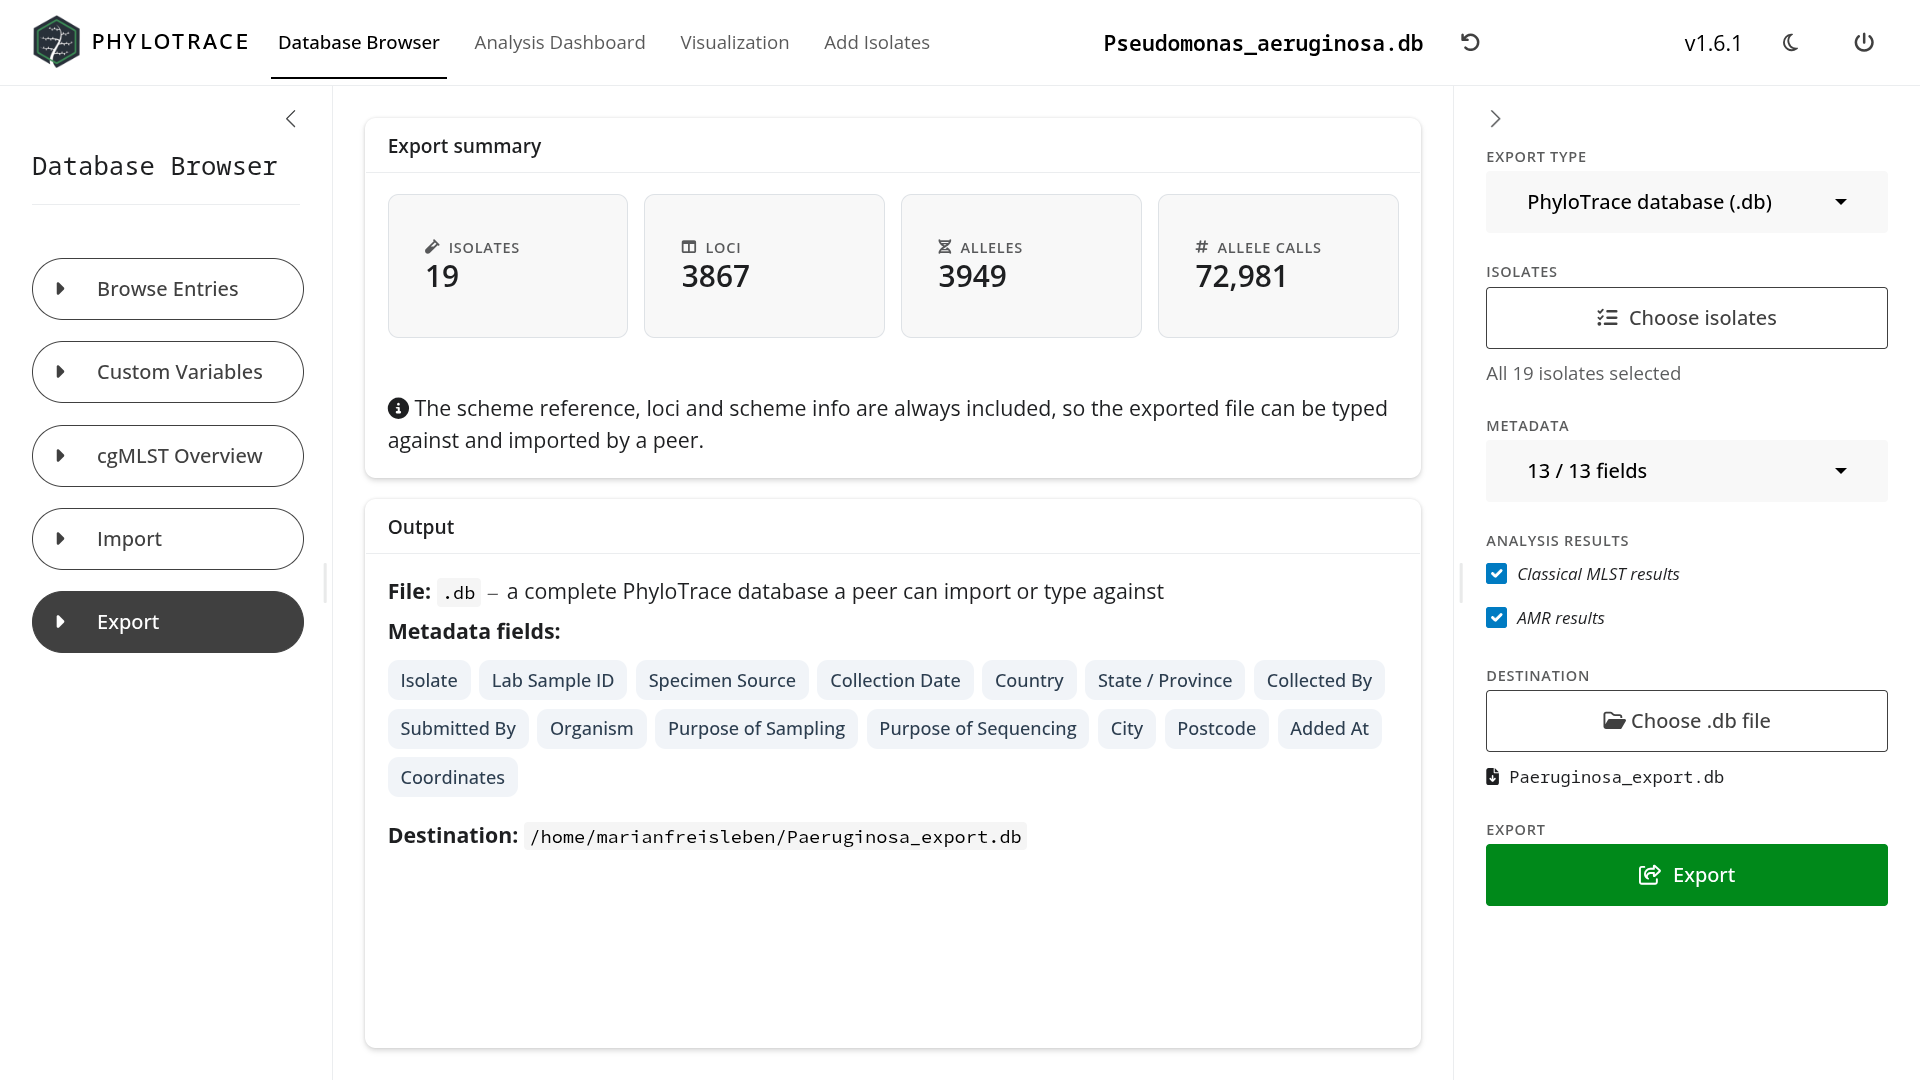
The data exchange interface enables seamless transfer between partner labs using SQLite and other standard formats. Users choose which data to share—including privacy-sensitive details. Because PhyloTrace runs locally without public servers, private data stays secure.
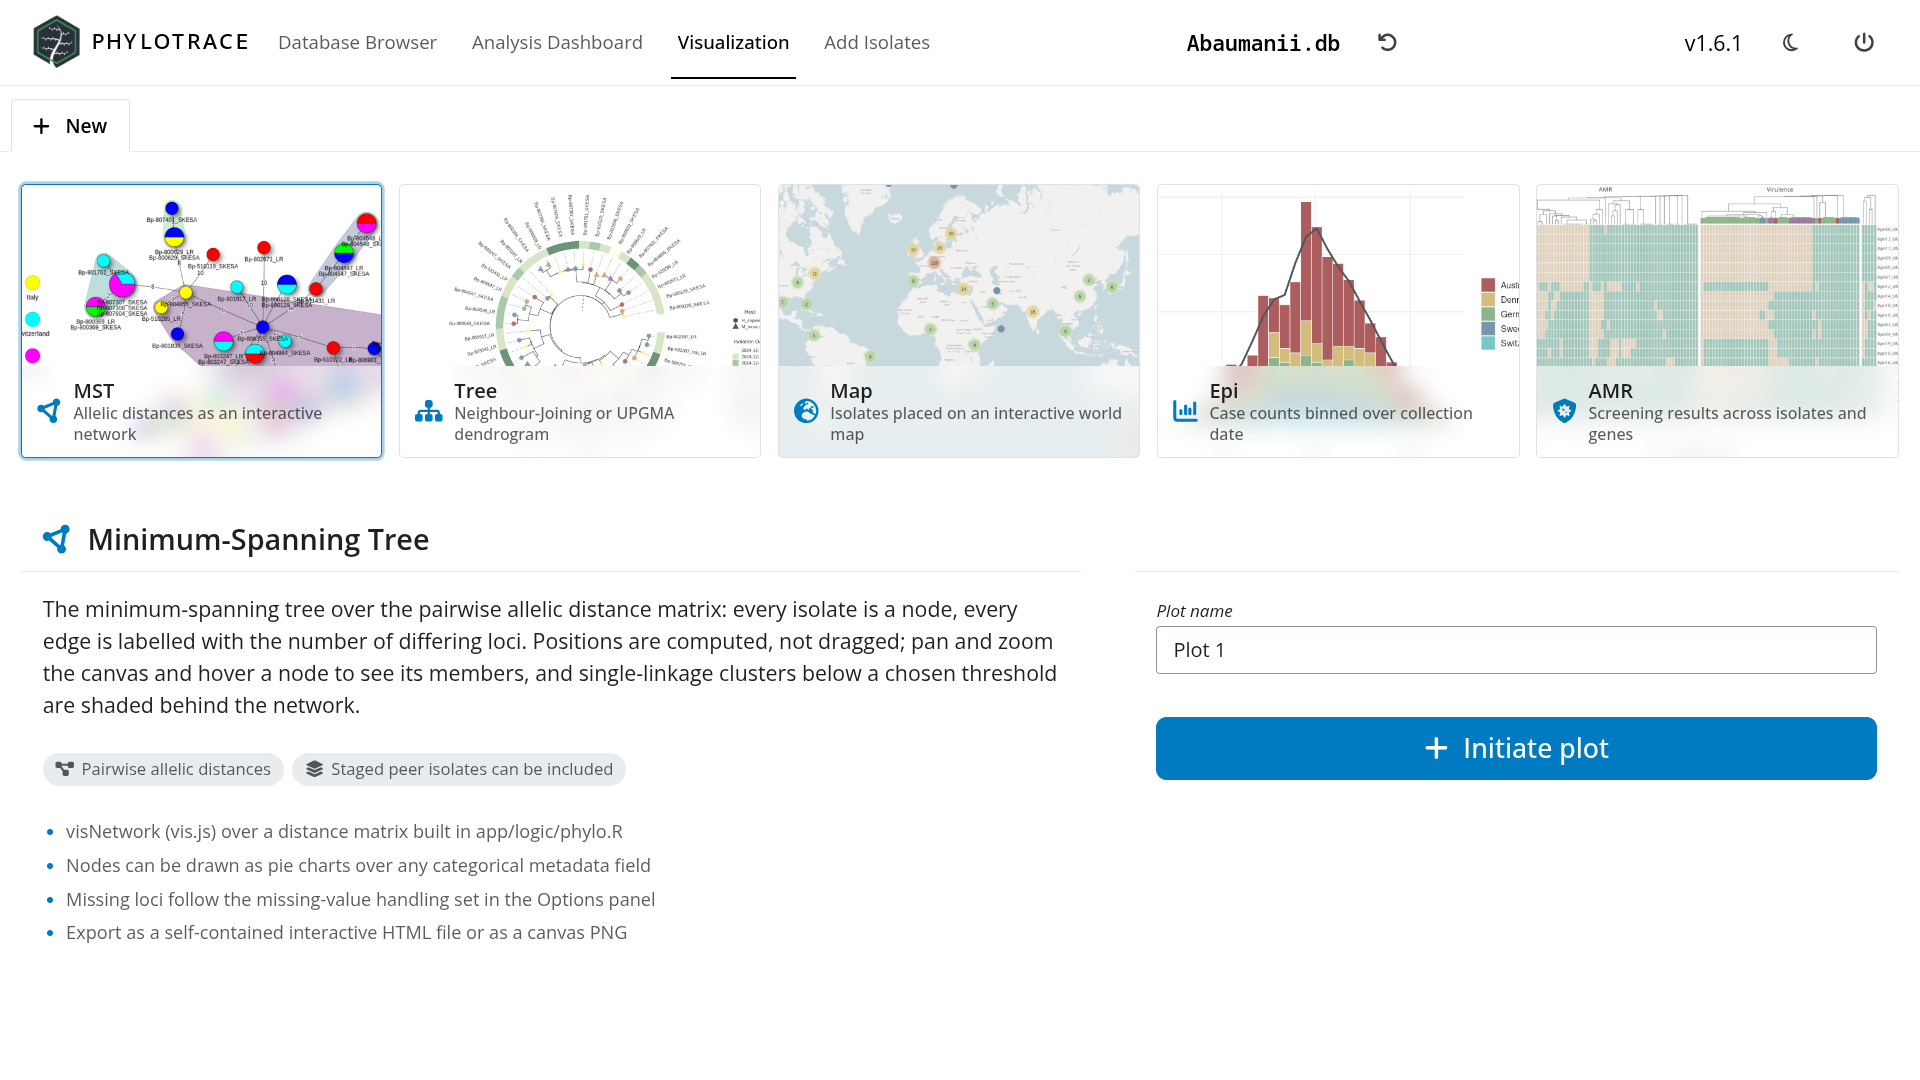
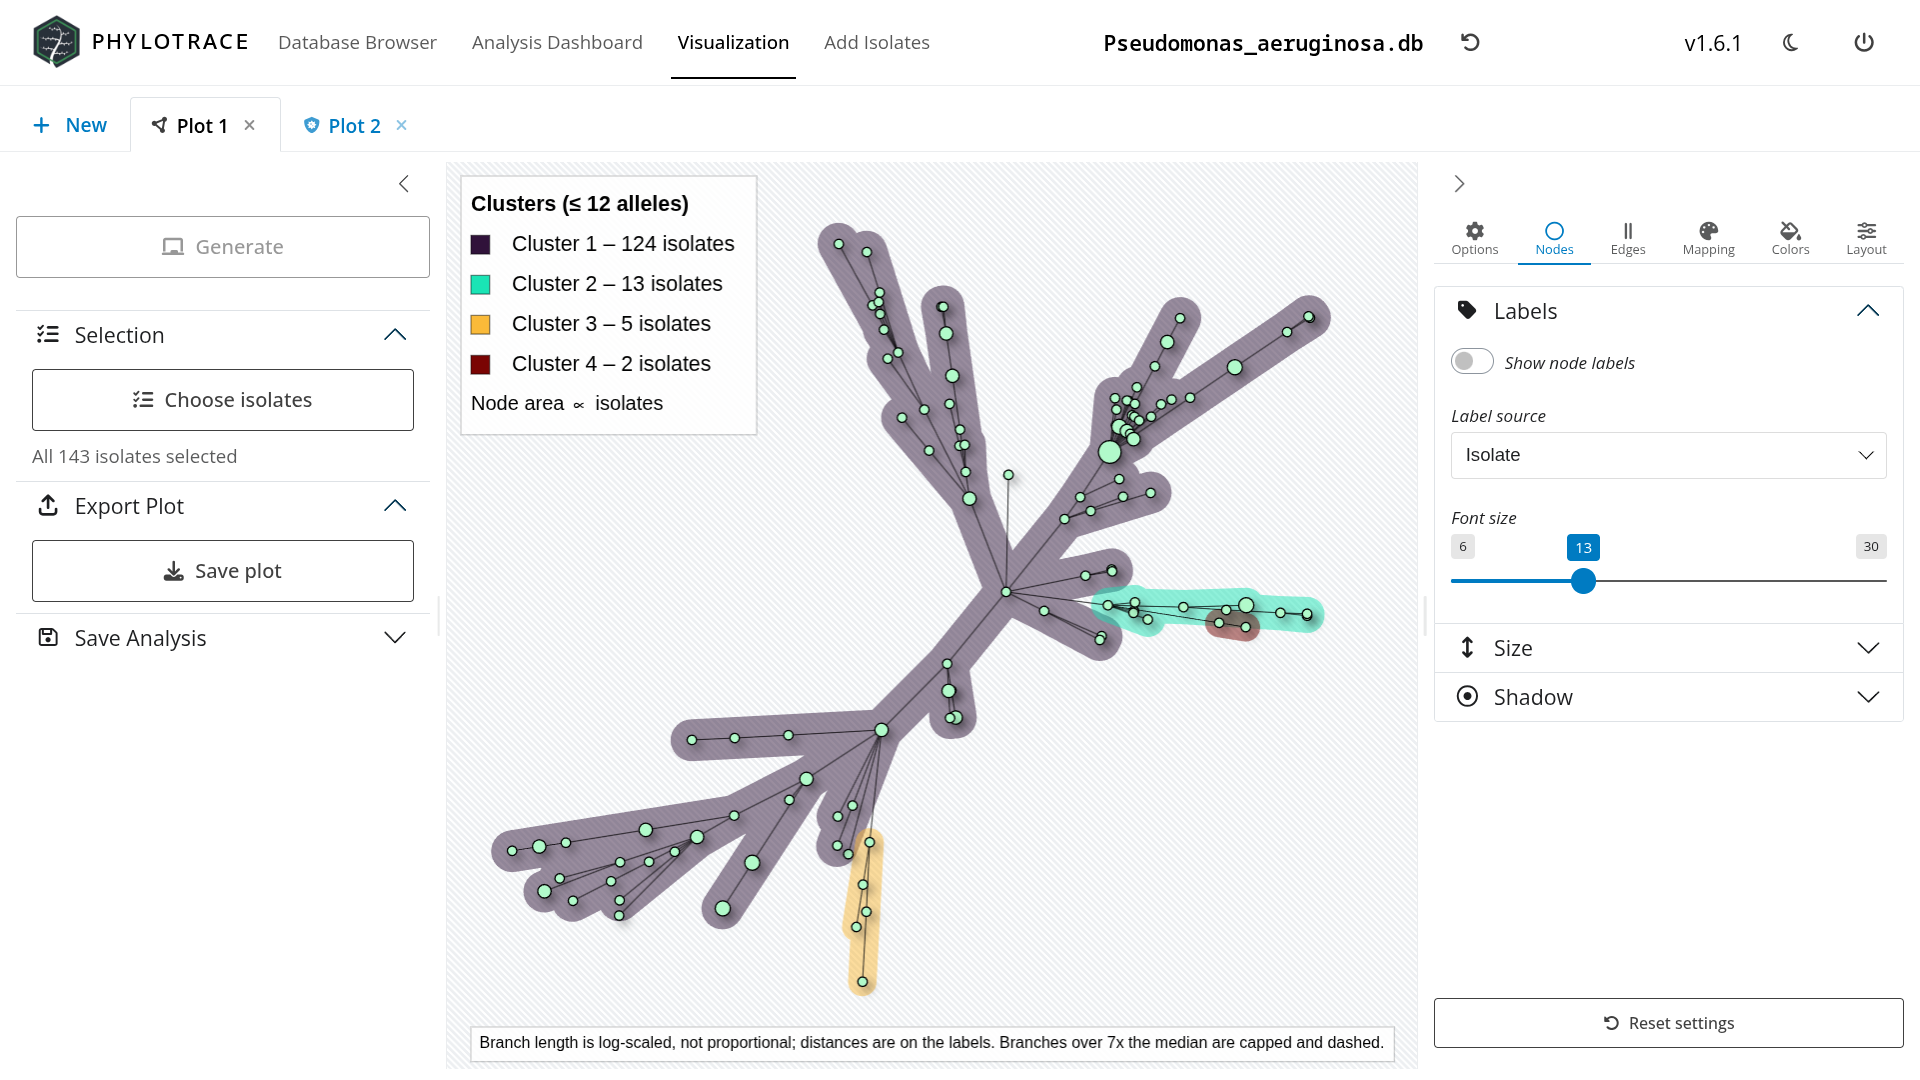
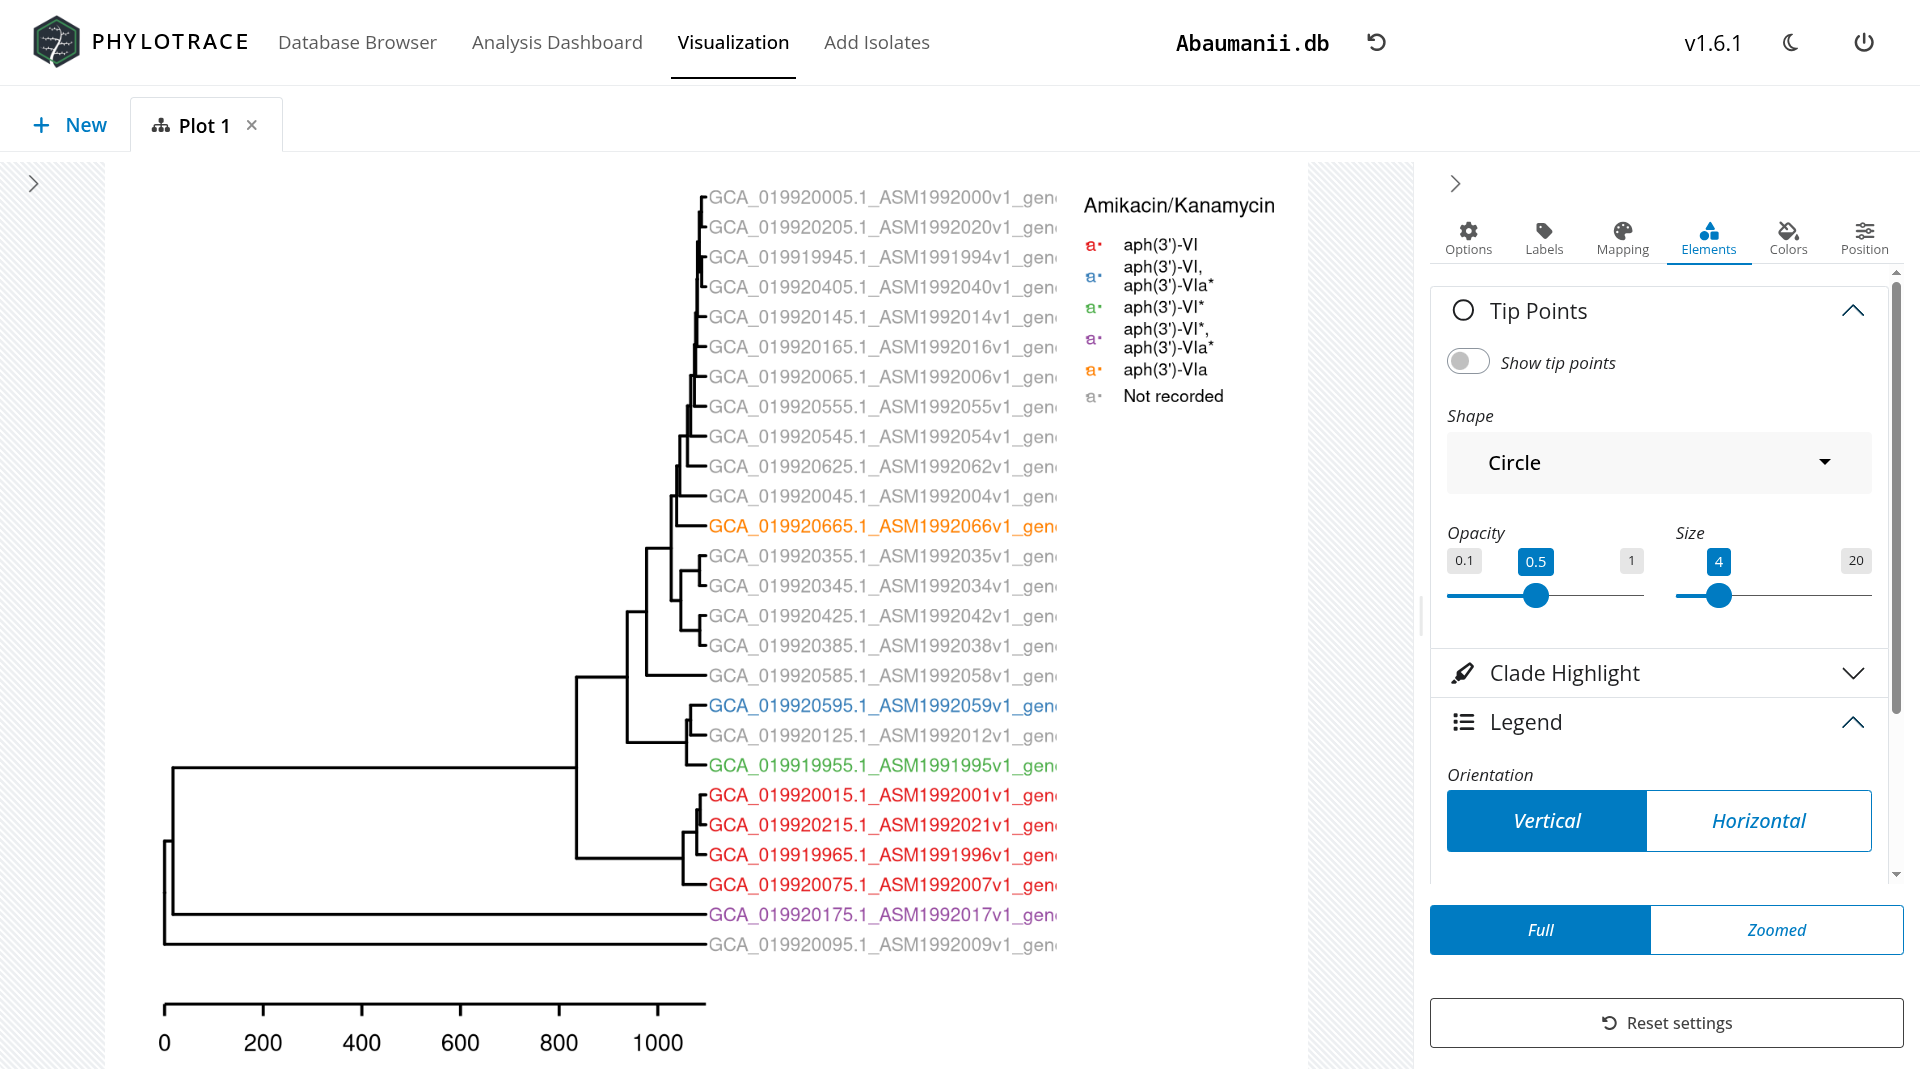
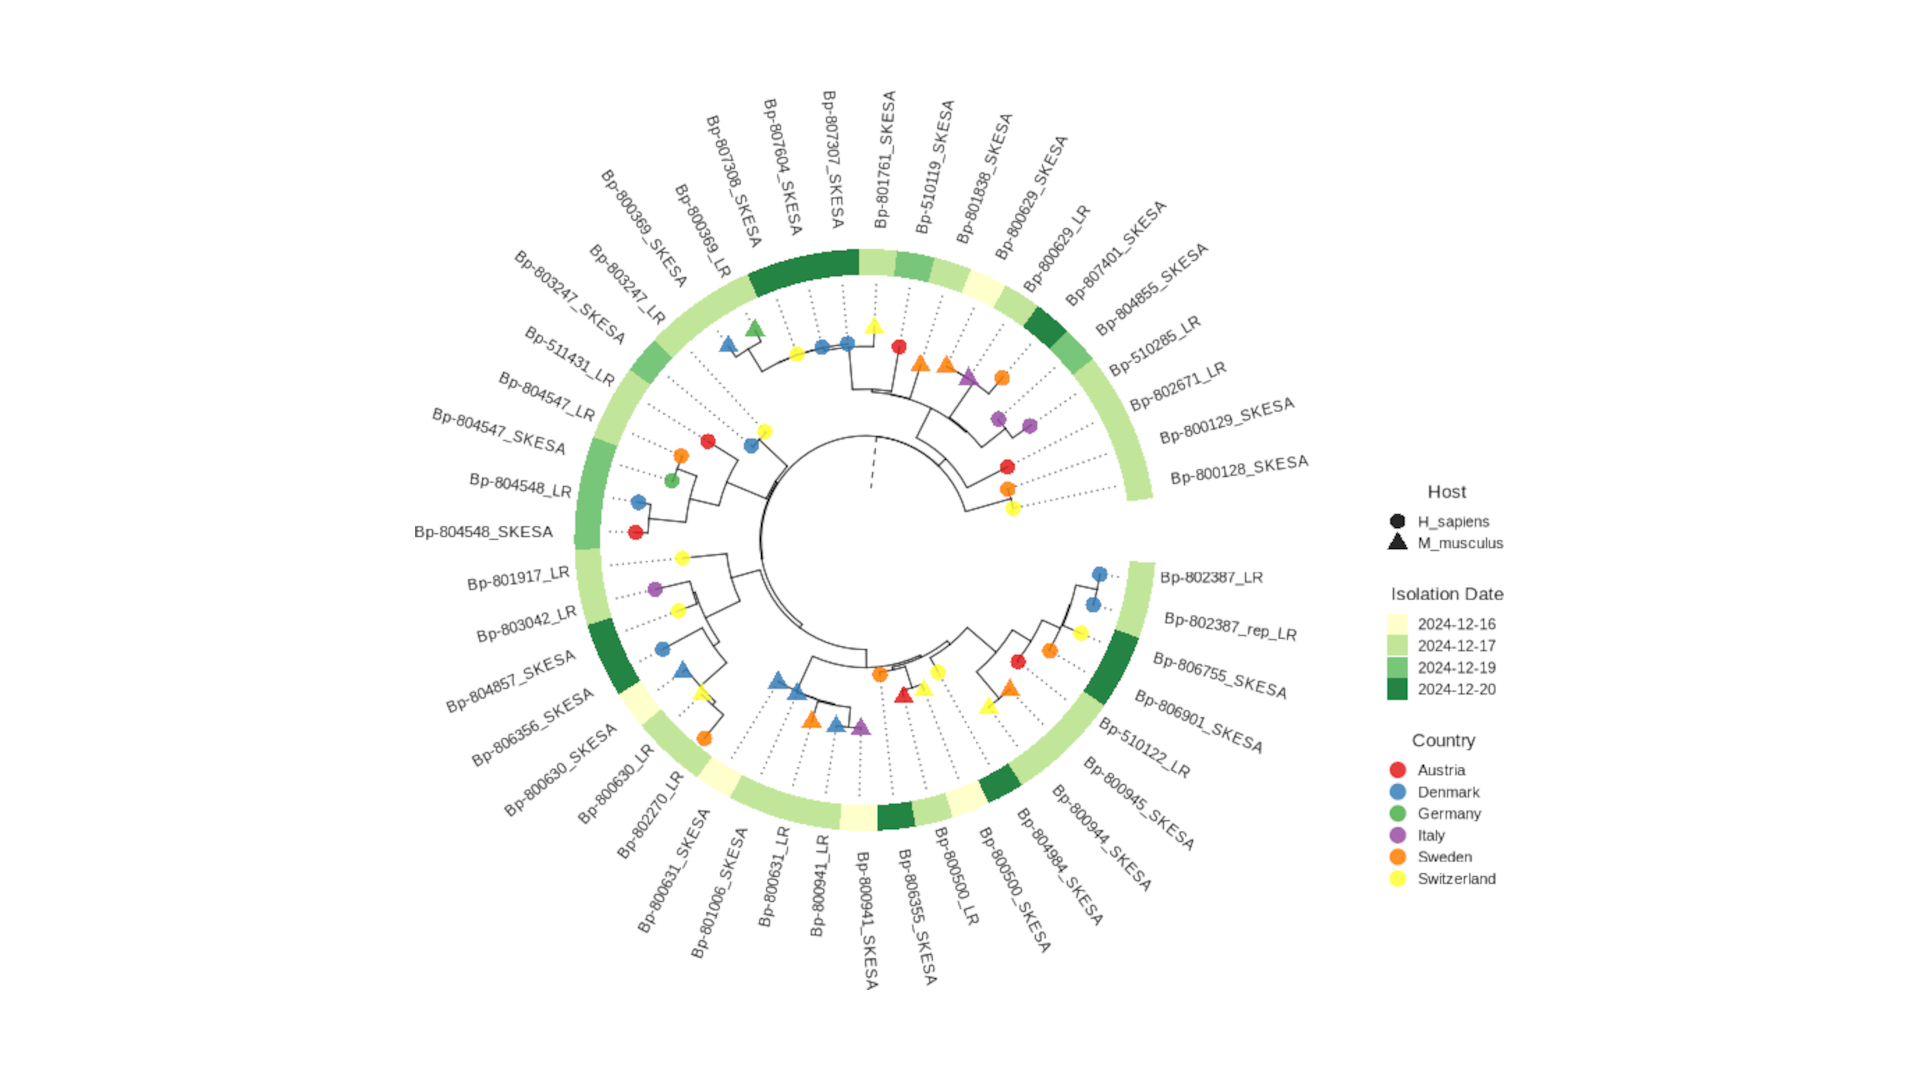
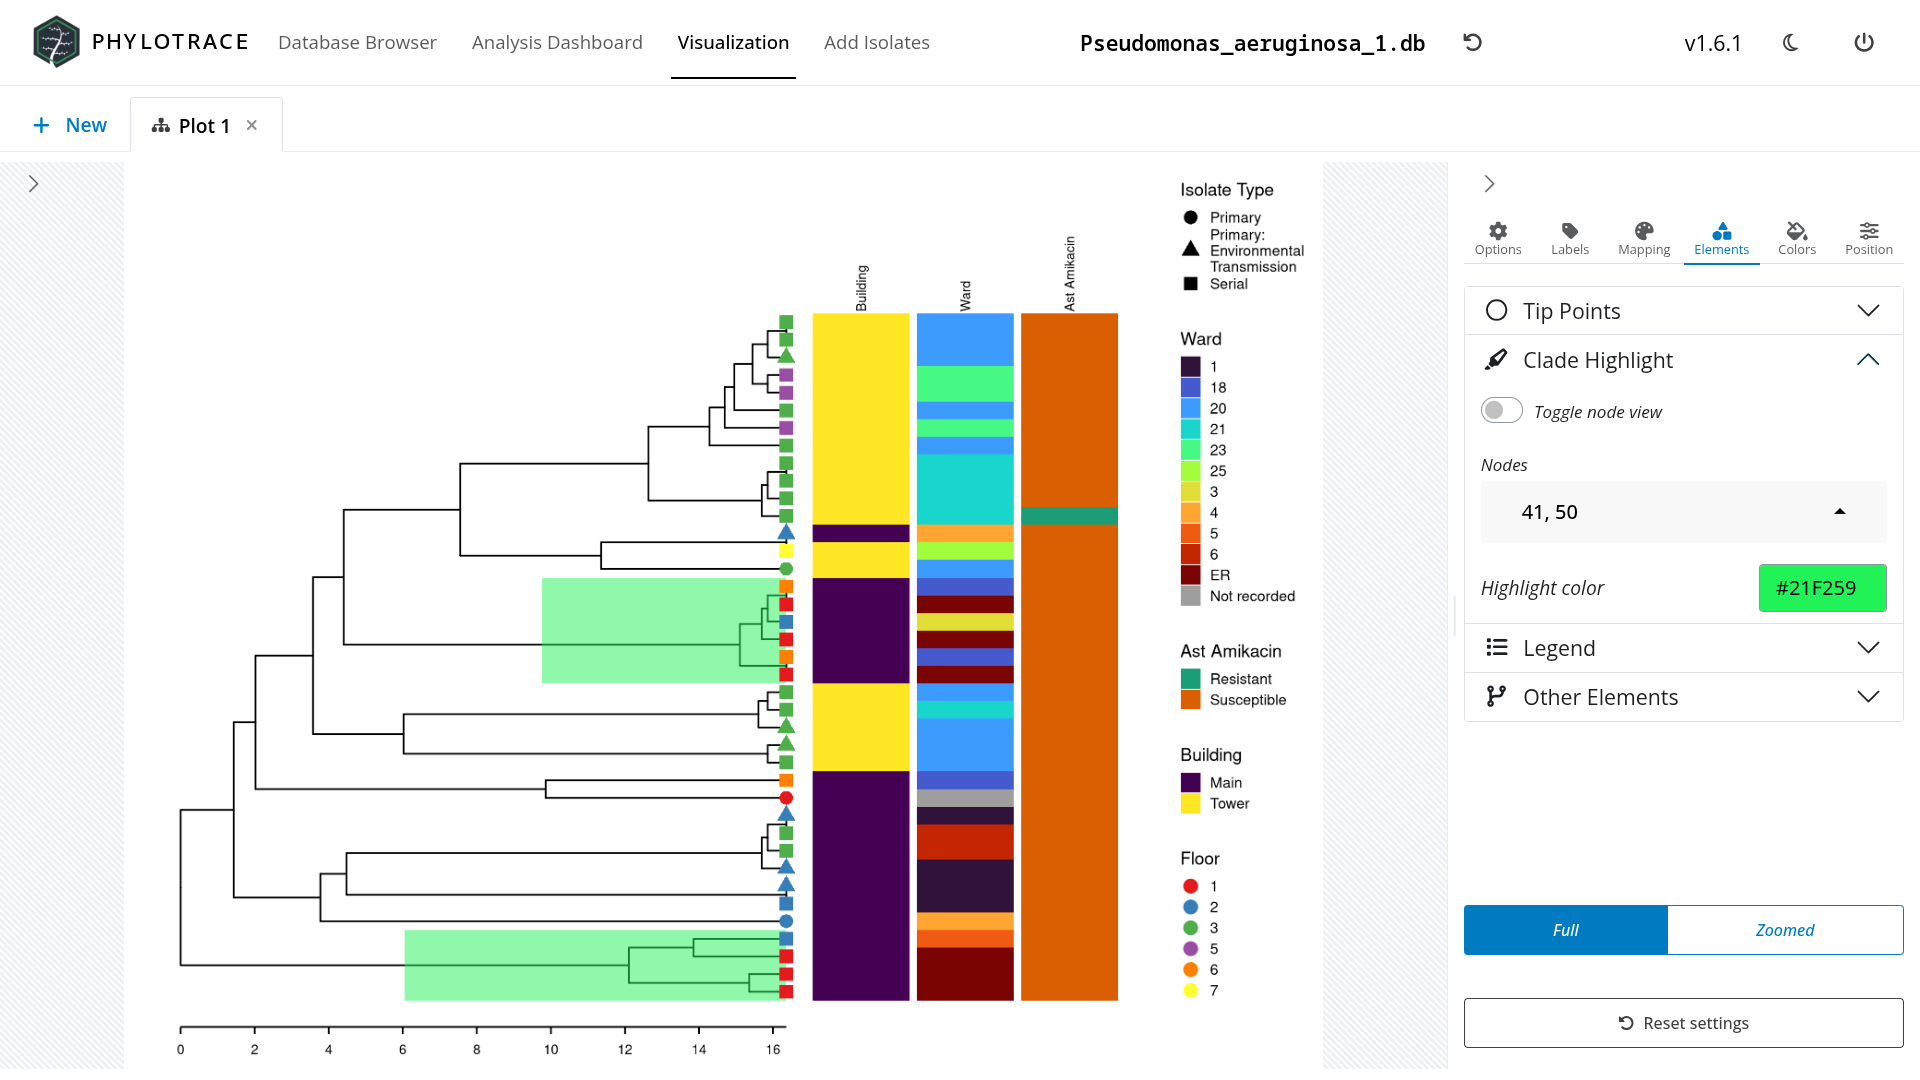
Track transmission patterns and population dynamics with interactive visualization of single-linkage networks (MST) and hierarchical trees (NJ, UPGMA). With fully customizable layouts, clustering and variable mapping.
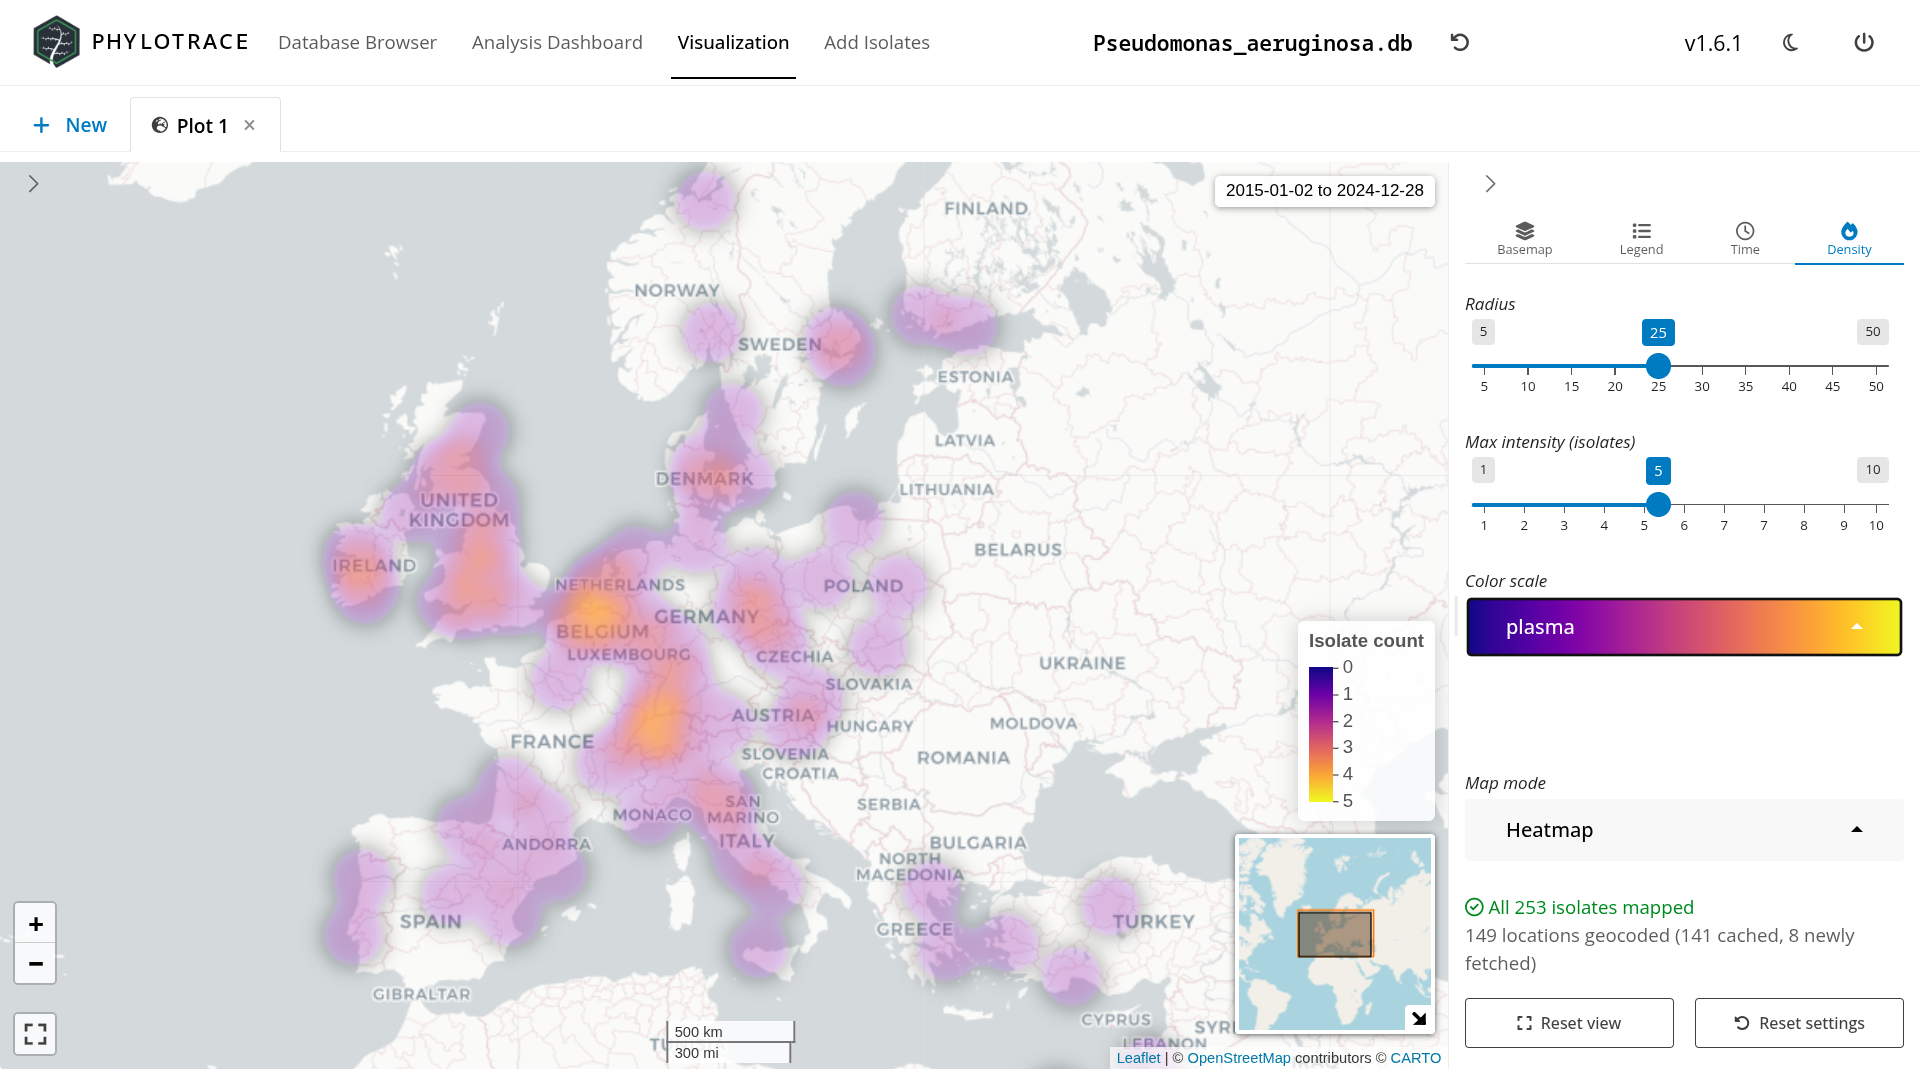
Track transmission events in geographic and temporal contexts. View interactive and time-resolved map overlays and epidemic curves to trace pathogen dynamics. The sophisticated visualisation interface helps to uncover patterns that might otherwise remain hidden in spreadsheets.
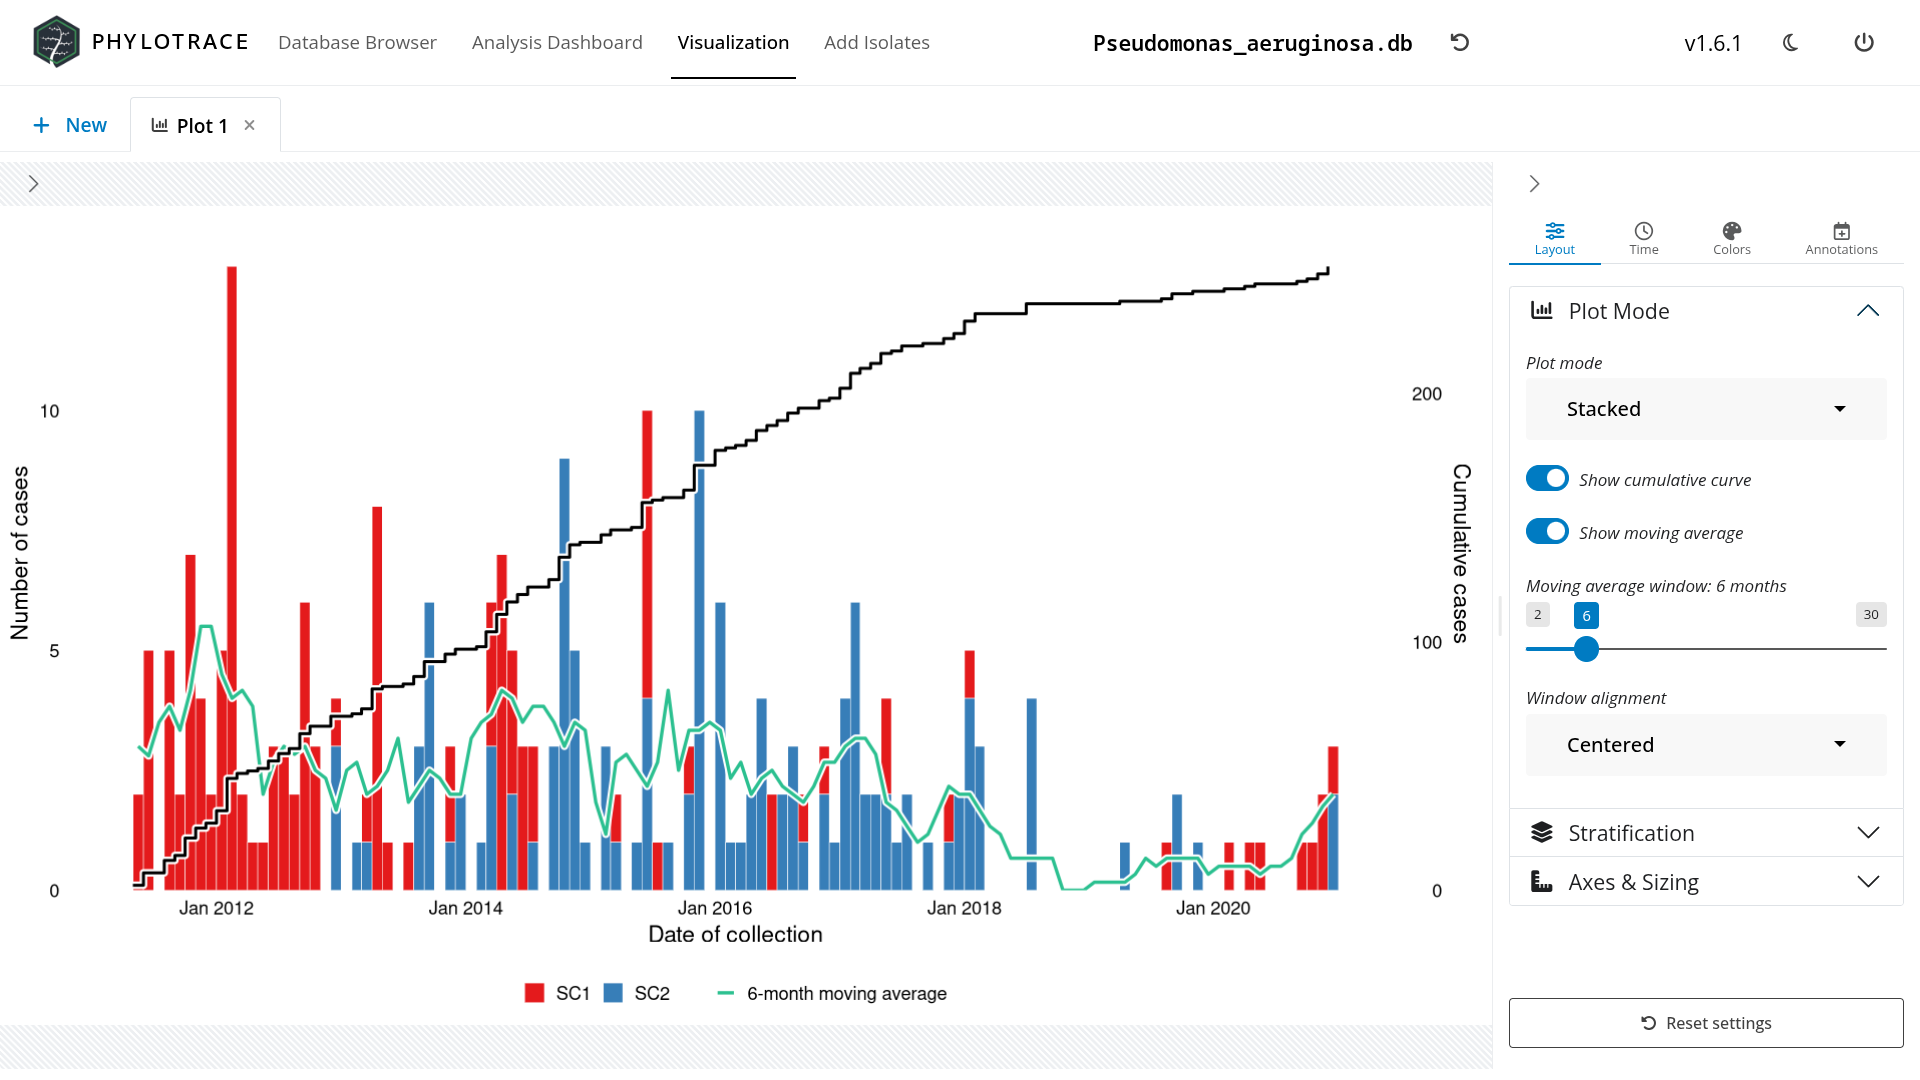
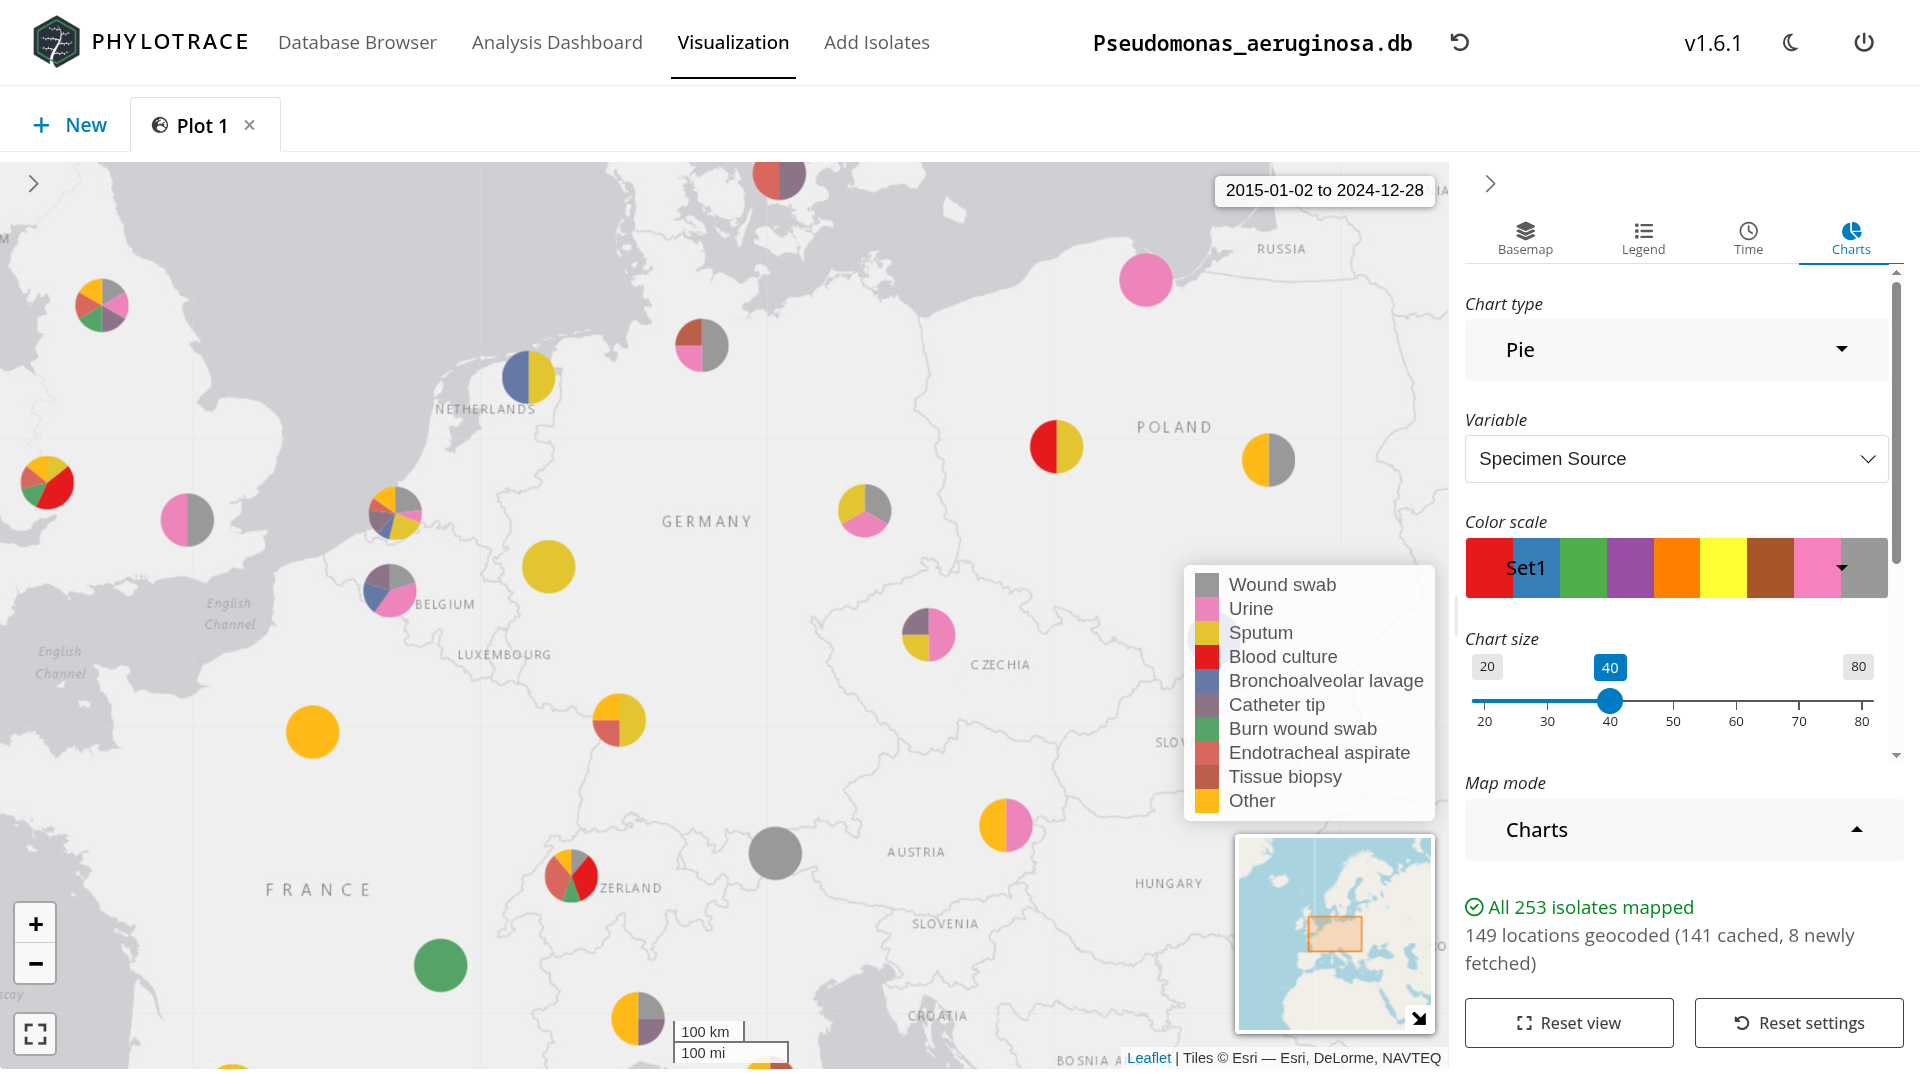
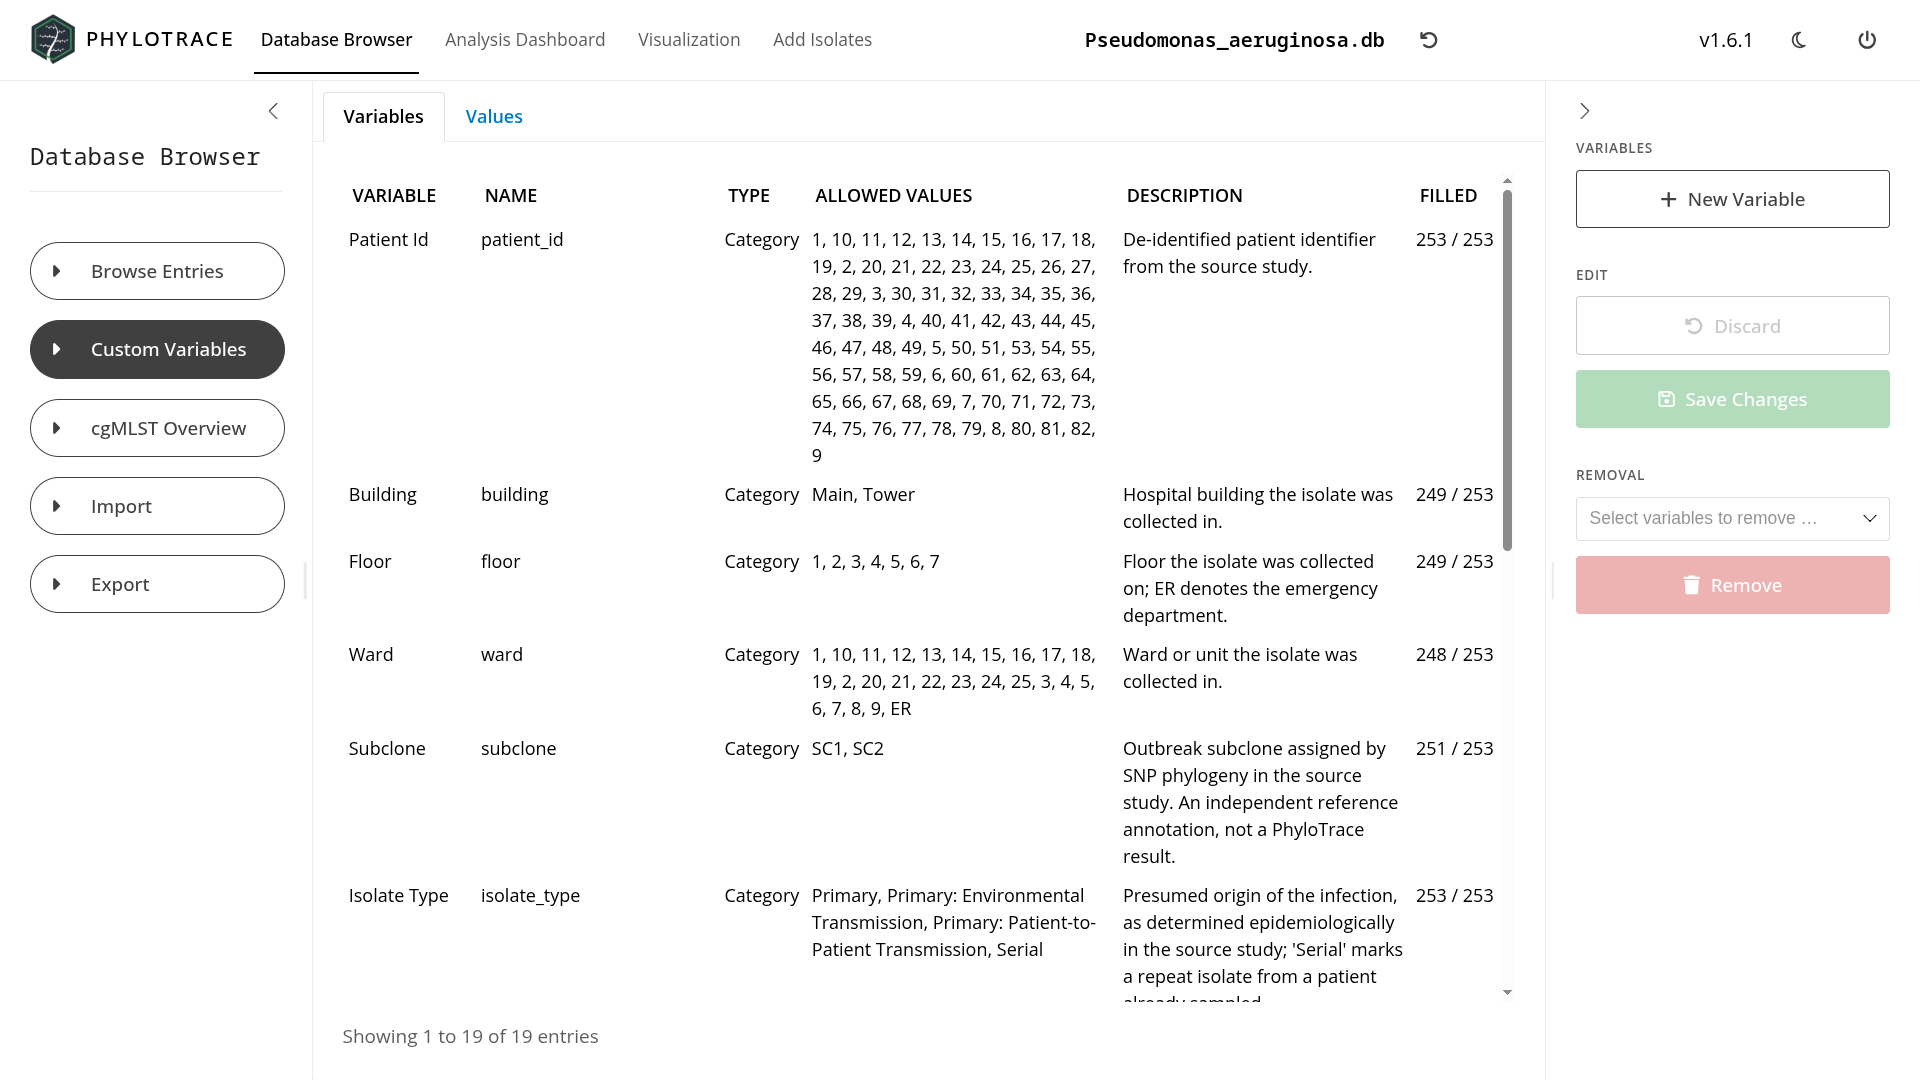
Declare custom metadata of any kind, e.g. clinical metadata, environmental variables, numerical data, etc. to sample records to dynamically group and enrich analyses with important context. Custom variables can be added to every visualization (trees, network graphs, geographical maps, epidemic curves).
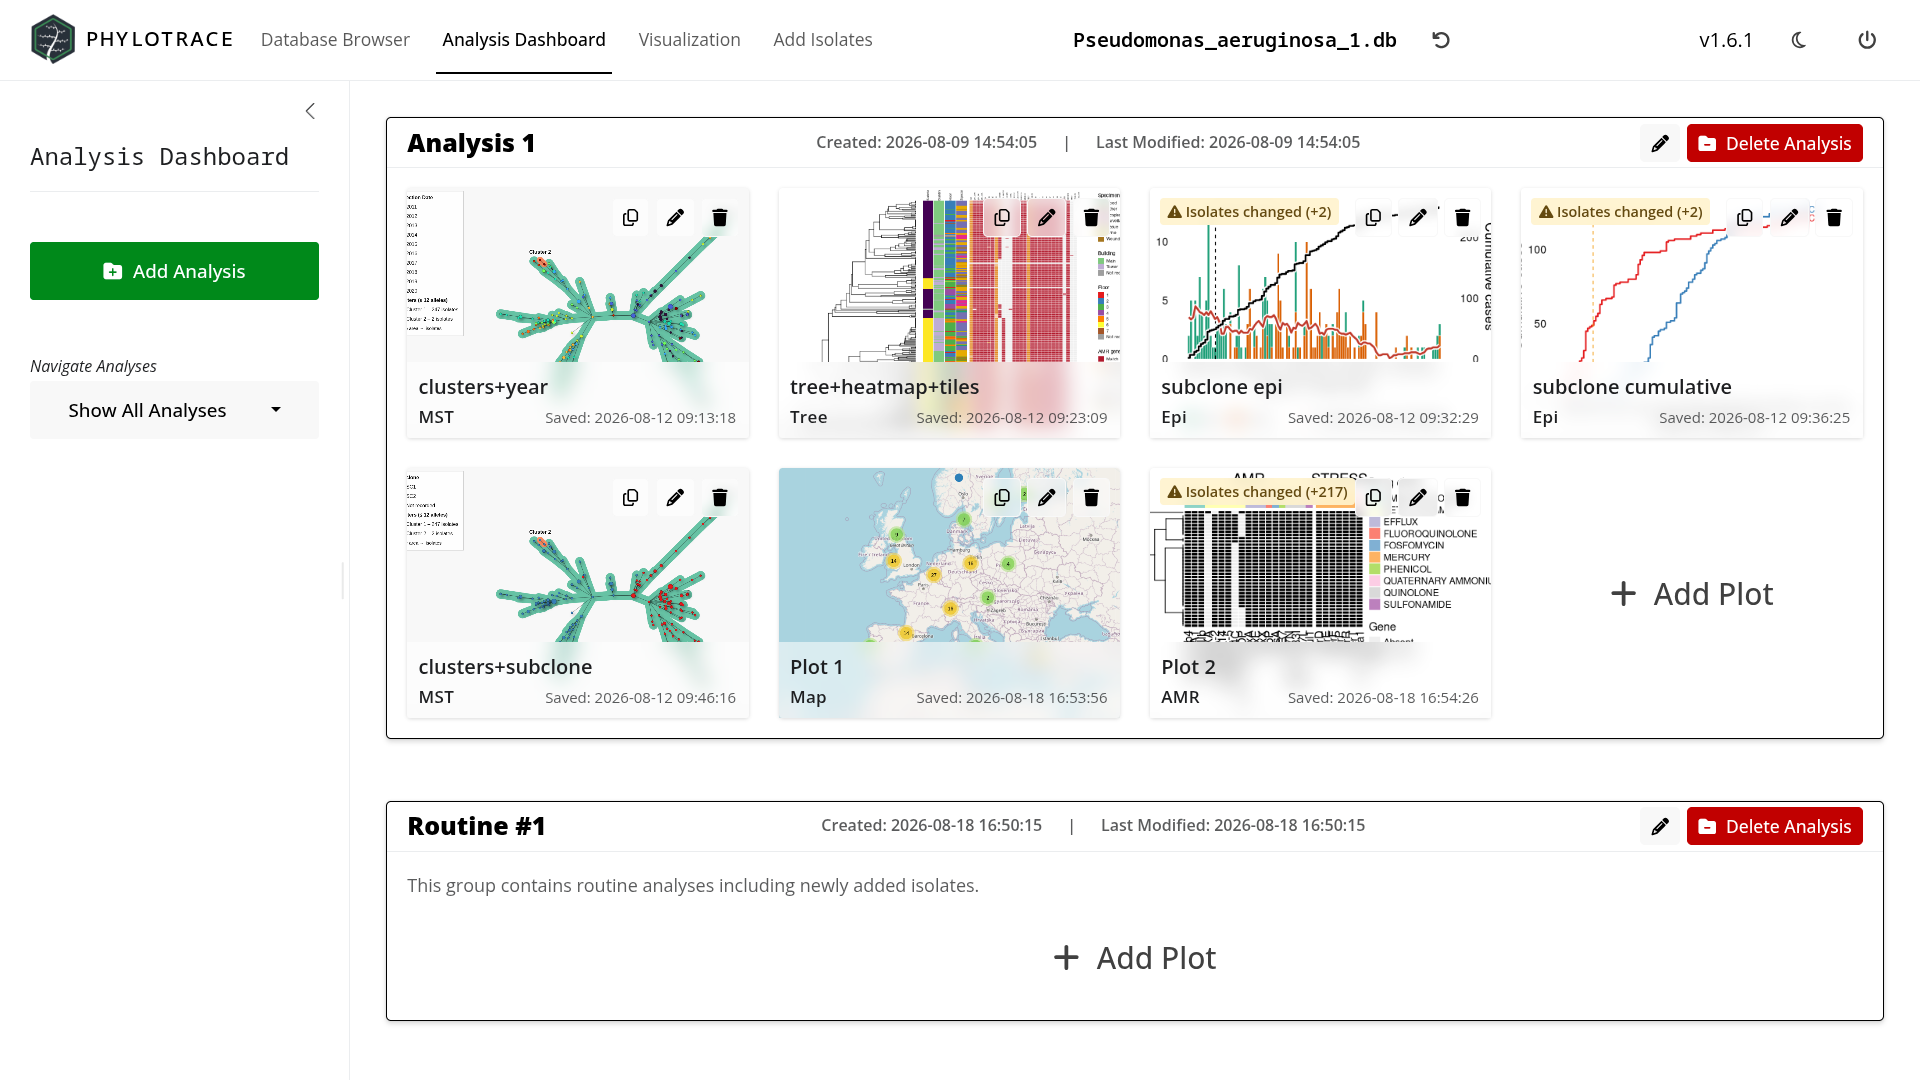
Routine surveillance or retrospective analyses can be managed and grouped with the analysis dashboard. Subsetting available isolates or snapshoting current database states makes analyses reproducible and shareable.